Best Python Chart Examples
The Python Graph Gallery has always been a reservoir of inspiration, providing hundreds of foundational chart examples for newcomers and seasoned developers alike.
While our vast collection offers a stepping stone into the world of data visualization, the following list stands out.
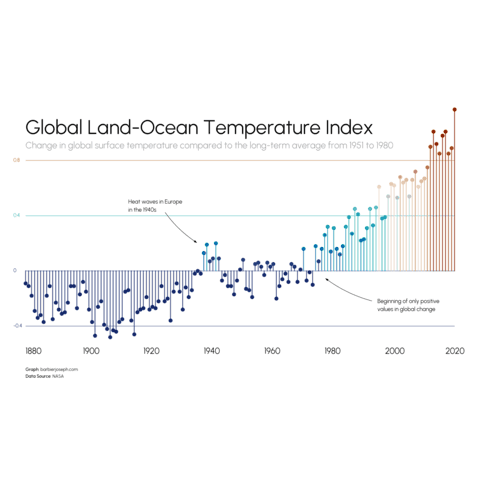
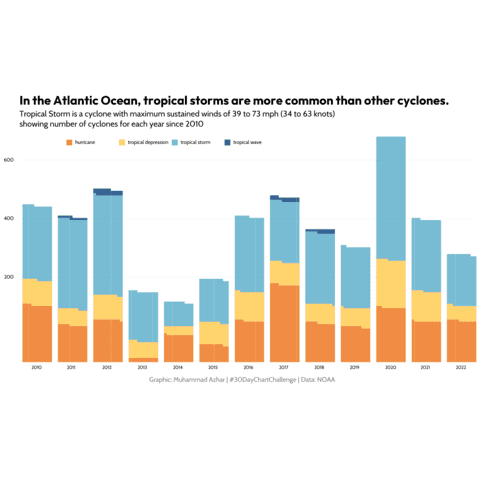
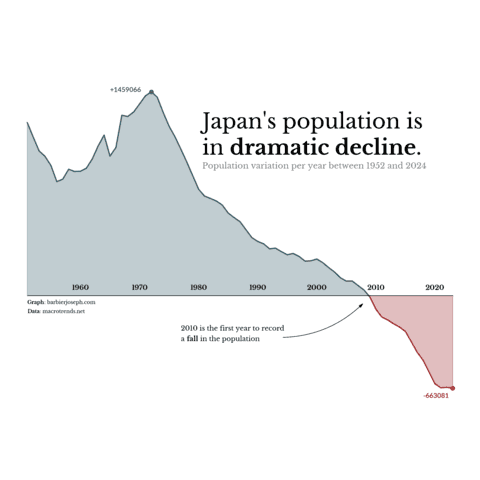
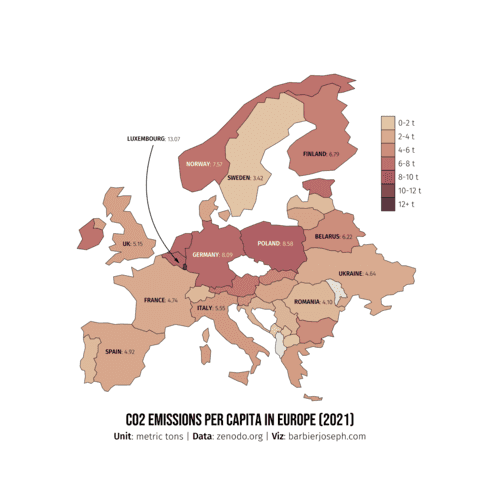
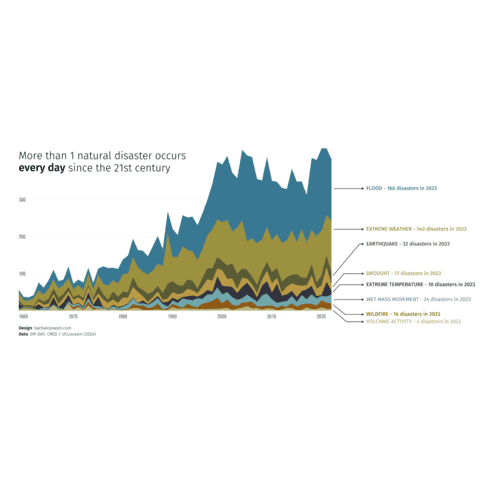
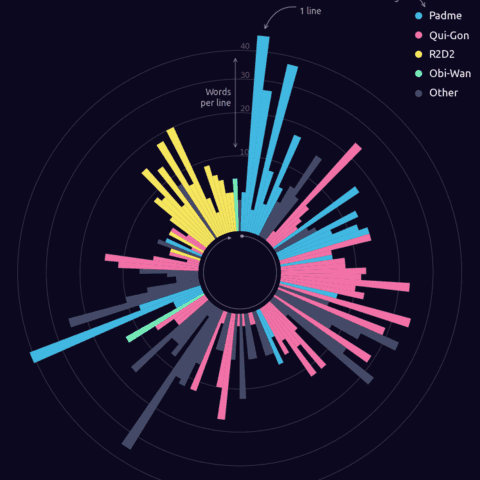
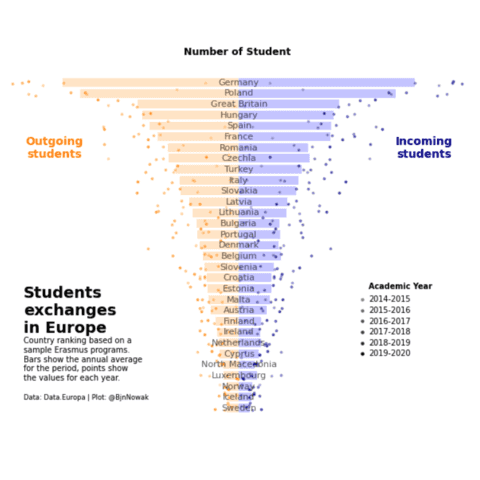
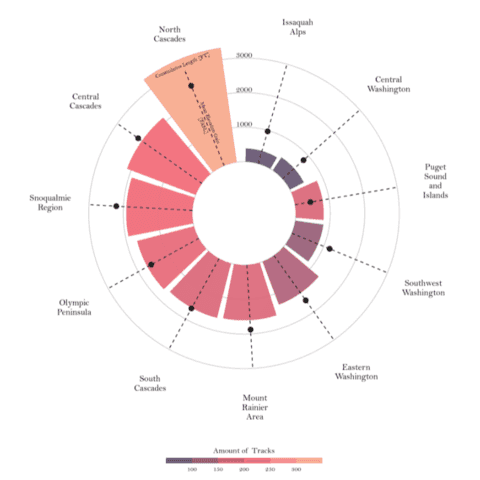
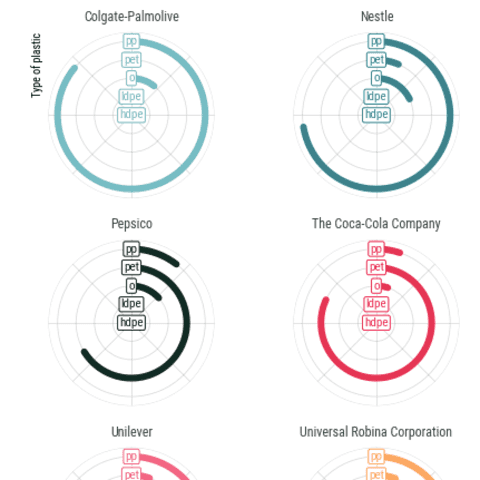
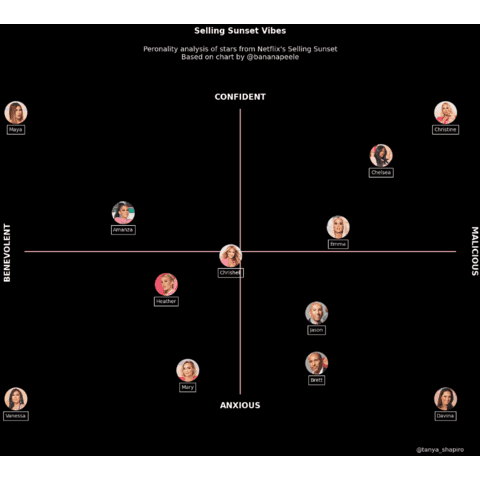
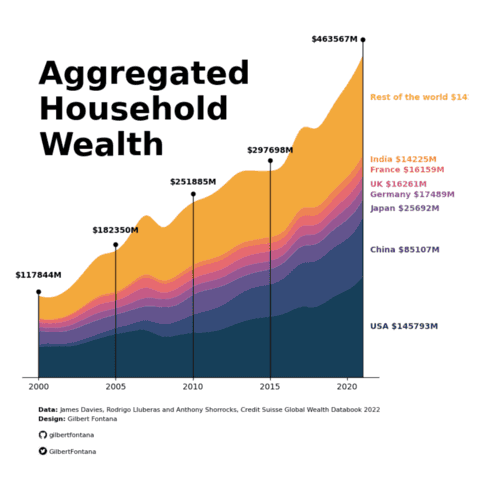
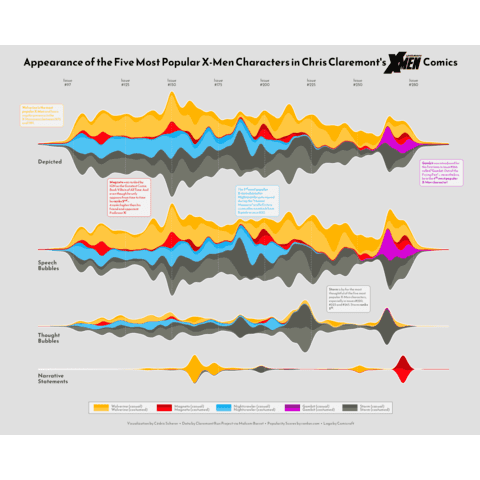
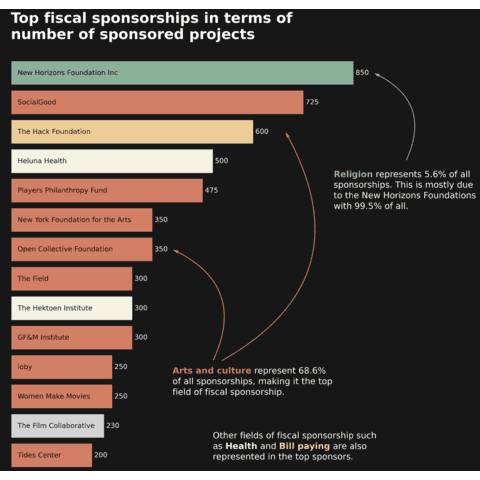
Every chart here represents the pinnacle of craftsmanship, exhibiting the depths to which matplotlib can be customized. These are not just graphs; they are polished masterpieces, ready for publication.
While I'm deeply indebted to the original authors for their stellar work, it's worth noting that many of these visualizations were first conceived in R, a testament to its rich visualization ecosystem. In an endeavor to bring the best to our Python community, I've translated these gems to further showcase the versatility and power of matplotlib.
Dive in and get inspired! 😍
PS: don't miss new publications, I send them to 4000+ subscribers already ⬇️
Note that I am always hunting for the best charts made with Python! If you have any examples in mind that should be showcased here, please let me know 🙏.
