The best Python libraries for data visualization
Python is very powerful when it comes to data visualization, especially thanks to its specialized packages that elevate its potential to unparalleled heights. Among these, matplotlib stands out as a foundational tool, offering a versatile platform for creating a wide array of plots.
However, the real magic unfolds when you delve into its extensions and the plethora of other visualization packages available such as seaborn, highlight_text or pypalettes. Together, they empower users to craft virtually any type of chart imaginable, showcasing the true versatility and power of Python in the realm of data visualization.
Python also comes with a set of great independant packages such as plotly, that provides a simple way to create interactive charts, and plotnine that uses the grammar of graphics as a syntax, pretty much like the more than famous ggplot2.
Core packages
There is only a few core packages in python when it comes to data visualization. Most other packages are actually built on top on them, meaning that they use those packages features to create new ones!
Here you can find them and learn:

Matplotlib extensions
Matplotlib extensions are specialized packages that build upon the core functionality of Matplotlib. These extensions provide additional features and capabilities, making it easier to create specific types of visualizations or enhance existing plots.


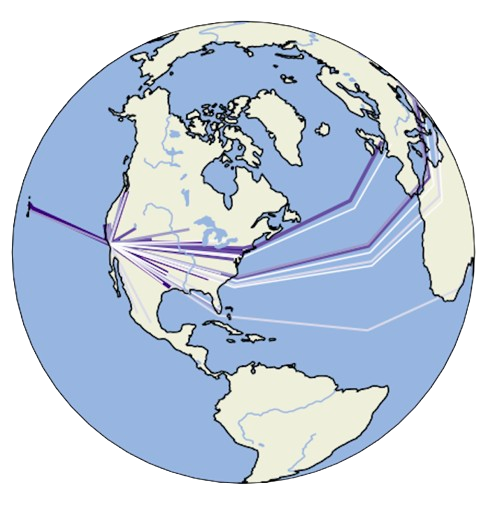
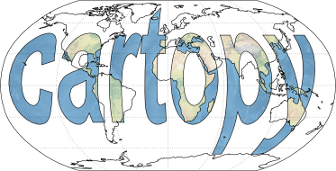
Geospatial packages
Geospatial packages in Python are designed to handle and visualize geographical data. These packages offer tools for creating maps, analyzing spatial information, and working with various types of geographic data formats.


Interactivity
Interactive visualization packages in Python allow you to create dynamic and responsive charts and plots. These tools enable users to interact with the data, explore different aspects, and gain deeper insights through features like zooming, panning, and hovering.


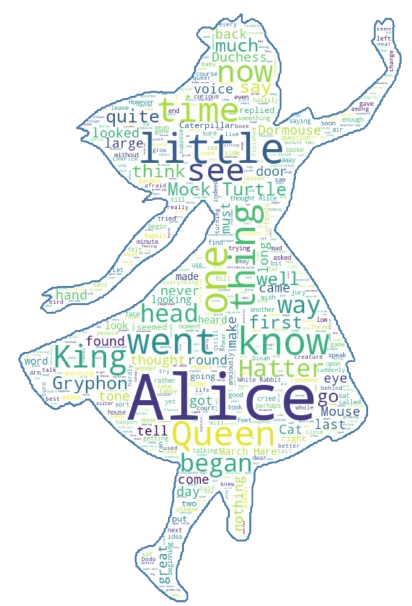
Specific chart types
Some Python packages are designed to excel at creating specific types of charts or visualizations. These specialized tools offer advanced features and optimizations for particular chart types, allowing you to create more sophisticated and tailored visualizations.


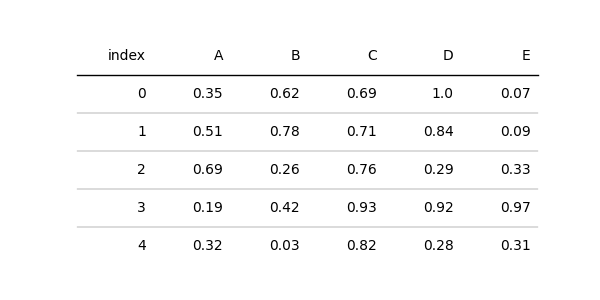
Tables
Table visualization packages in Python provide tools for creating attractive and informative tables to display your data. These packages offer various styling options, formatting features, and the ability to integrate tables with other visualizations.

General Knowledge


Colors


Interactivity

Animation


Cheat sheets


Caveats


3D


Statistics
🚨 Grab the Data To Viz poster!
Do you know all the chart types? Do you know which one you should pick? I made a decision tree that answers those questions. You can download it for free!
