Streamgraph

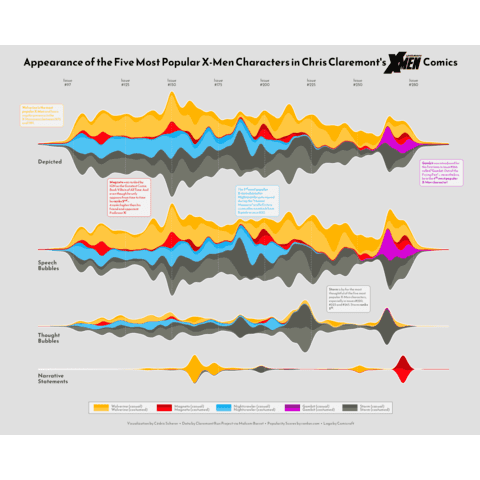
A streamgraph is a variation of the stacked area graph. It displays the evolution of a numeric value for several groups. Each group is displayed around a central axis and edges are rounded resulting in a flowing and organic shape.
 Streamgraph with
 Matplotlib
Matplotlib can build streamgraphs but there isn't any prebuilt function for it so be ready for quite a lot of code. 🍿
The process starts pretty much like for a stacked area graph. The baseline parameter of the stackplot() function is used to place groups around the X axis. The tricky part is to interpolate points between each value of the X axis to get the smooth visual. This is done thanks to the scipy.interpolate library.
🔎 stackplot() function parameters→ see full doc
→ Description
The stackplot() function from matplotlib creates a stacked area plot. This type of plot is used to show how multiple variables change over time, with each variable stacked on top of the previous ones. It's particularly useful for visualizing the composition of a whole over time.
→ Arguments
Description
The x coordinates of the data points.
Possible values → array-like
Pass a 1D array-like object for the x-axis values. This is typically the time axis.
Code Example
import matplotlib.pyplot as plt
import numpy as np

x = np.arange(10)
y1 = np.random.rand(10)
y2 = np.random.rand(10)

fig, ax = plt.subplots(figsize=(10,10))
ax.stackplot(x, y1, y2)
plt.show() Best python streamchart examples
The web is full of astonishing charts made by awesome bloggers, (often using R). The Python graph gallery tries to display (or translate from R) some of the best creations and explain how their source code works. If you want to display your work here, please drop me a word or even better, submit a Pull Request!


