Dealing with colors in matplotlib

Matplotlib offers extensive customization of plots, including a wide range of features for working with colors.
Dealing with colors in Matplotlib can be challenging. This page is here to address all your needs. It begins with tips on how to apply a single color to a chart, and then discusses accessing color palettes for both continuous and categorical data.
Finally, it introduces pypalettes, a Python library that provides access to 2,500+ color palettes. It also includes a color palette finder tool that you are sure to love. 💜
1️⃣ Applying a single Color
That's the most simple use-case. You just made a chart that has an uniform default color and want to change it.
All Matplotlib plotting function have a color argument allowing to control the color.
The color can be provided in multiple ways:
- Named colors: Use the name of the color. For example,
red,blue,green. - RGB colors: Use a tuple of 3 values between 0 and 1. For example,
(1, 0, 0)for red. Note that a 4th value can be provided for the opacity. - Hexadecimal colors: Use the hexadecimal code. For example,
#FF0000for red.
Code would look like this:
# Hexadecimal color code
color = "#FF5733"

# Pre-defined color names
color = "skyblue"

# RGB tuple
color = (0.1, 0.2, 0.5)

# RGBA tuple
color = (0.1, 0.2, 0.5, 0.4)

# Use in a barplot
fig, ax = plt.subplots()
ax.bar(x, y, color=color)
We wrote a post that goes in-depth in this topic. It also lists all the premade-colors.
2️⃣ Categorical / Qualitative color palettes
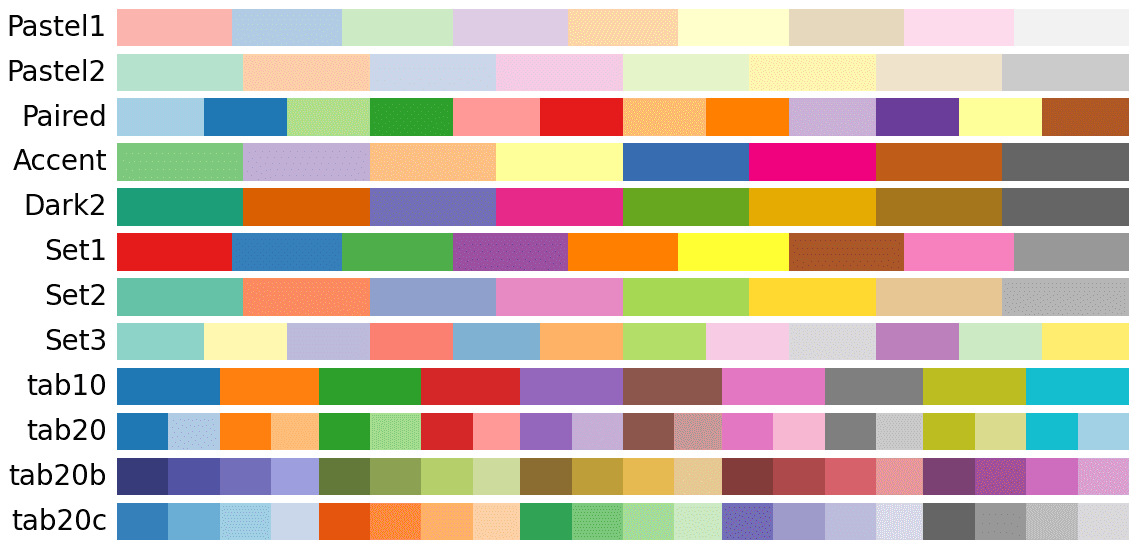
Qualitative color schemes represent categorical variables, where the possible values of the variable are discrete and unordered.
Example: you want to color group A in blue, group B in red and so on. This applies for barplots, pie charts, scatterplot or any other chart that can be split by group.
Method 1: use a matplotlib pre-made palette
Matplotlib provides a set of pre-made categorical palettes that are ready to be used.
Read this post to find the entire list and to understand how to use those palettes.
Basically, you will have to create a color map using the get_cmap() function and pass this color map to the color argument of the function you're using.
Method 2: more palette with pypalettes
Matplotlib only offers about a dozen qualitative palettes. So we've just created pypalettes, a python library that offers 2500+ color palettes. The library is described in depth below.
Method 3: provide an array of colors
You can pick some colors manually, and provide them as an array to the color argument of the matplotlib function you're using.
I strongly advise not doing this though. It's time consuming and finding colors that go well together is a struggle.
3️⃣ Continuous color palettes
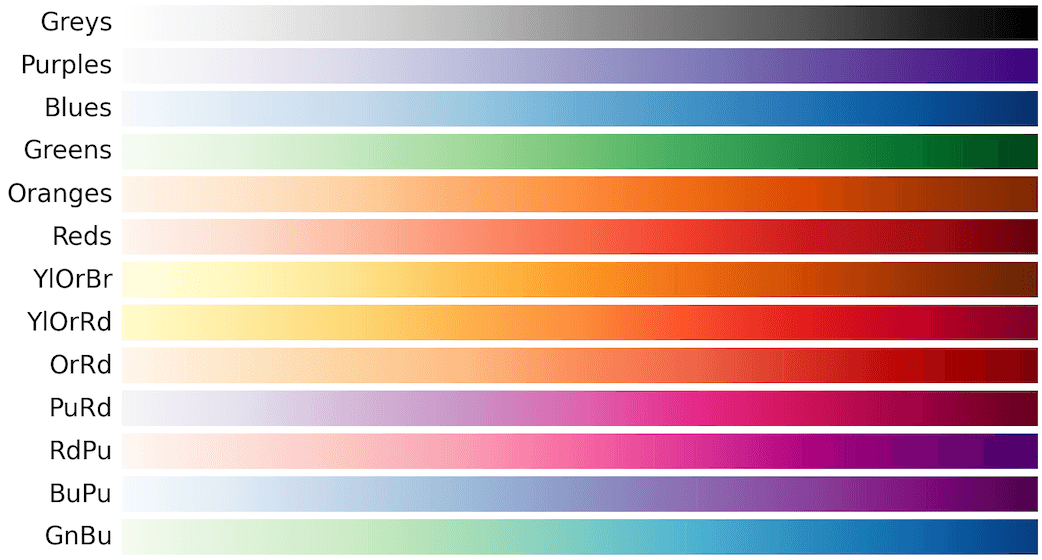
A continuous color palette is a smooth gradient of colors that transitions seamlessly from one hue to another.
Example: you want to encode a value with a color. For instance, 0 will be in light blue, and 100 will be in dark blue. This applies for heatmap, choropleth maps for example.
Method 1: use a matplotlib pre-made palette
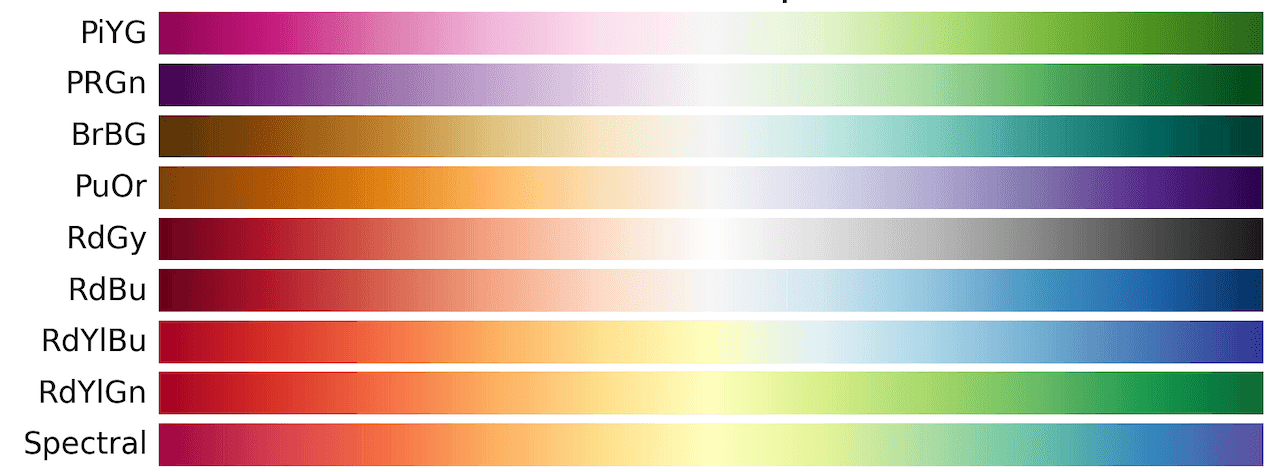
Matplotlib provides a set of pre-made continuous palettes that are split into 2 main categories:
- Sequential: for representing data that ranges from low to high values.
- Diverging: for representing data that ranges from negative to positive values.
We've written a post that will guide you through their usage, and provides an exhaustive list of all the available continuous palettes.
Method 2: more palette with pypalettes
pypalettes is a python library that offers 2500+ color palettes. The library is described in depth below and will be useful if you're not satisfied with matplotlib built-in options.
Method 3: create your own
Strongly discouraged: you will struggle to build something great.
But definitely doable. See the last section of this page!
4️⃣ Need more palette options? Check pypalettes.
PyPalettes is a Python library that gives access to 2500+ palettes.
It's hosted on github, you can install it with PyPI, and it's super easy to use.
User-friendly API
pypalettes is pretty straightfoward to use. For instance, this is how to use a palette called Acadia once the library is installed:
# Import pypalettes
from pypalettes import load_cmap

# Load the palette called Acadia
cmap = load_cmap("Acadia")

# Use the color map anywhere!
The pypalettes API is super intuitive, and we've written a digestible post to explain how it works.
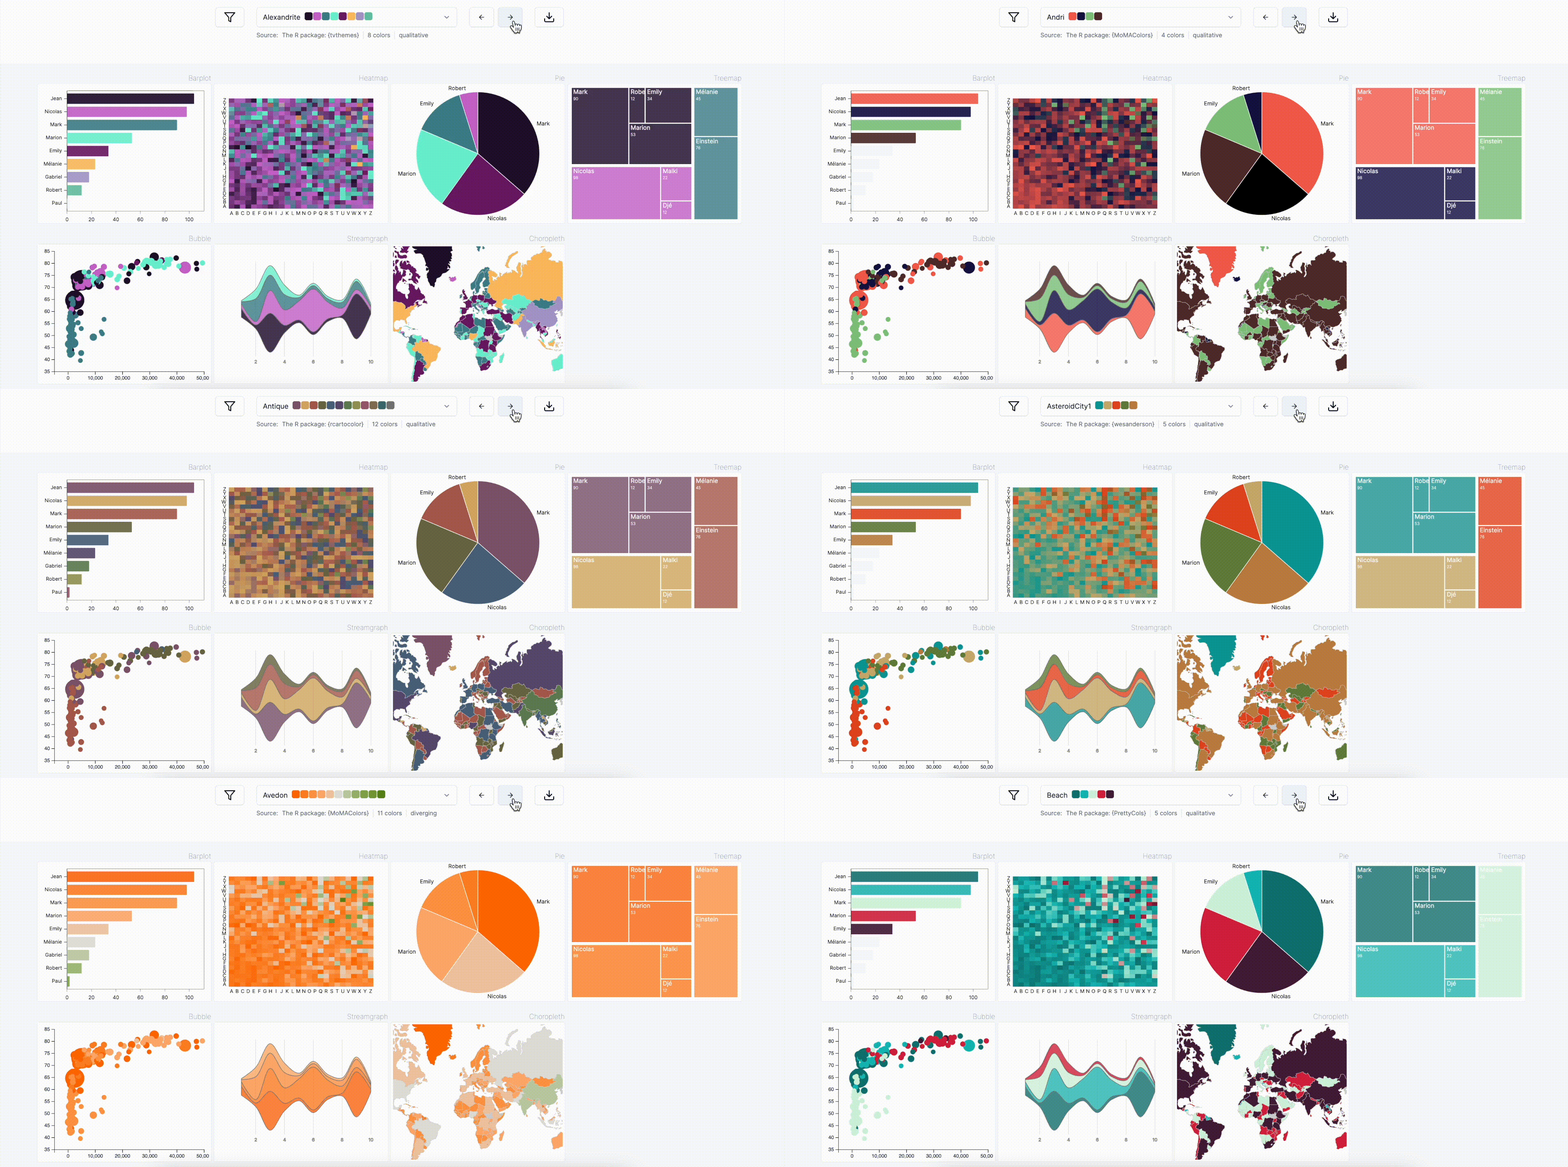
Color palette finder
Last but not least, we've also built a color palette finder.
It allows to quickly explore all the options, see them in action on 7 different charts, export their code, simulate color blindness, and so much more.
5️⃣ How to work with color maps
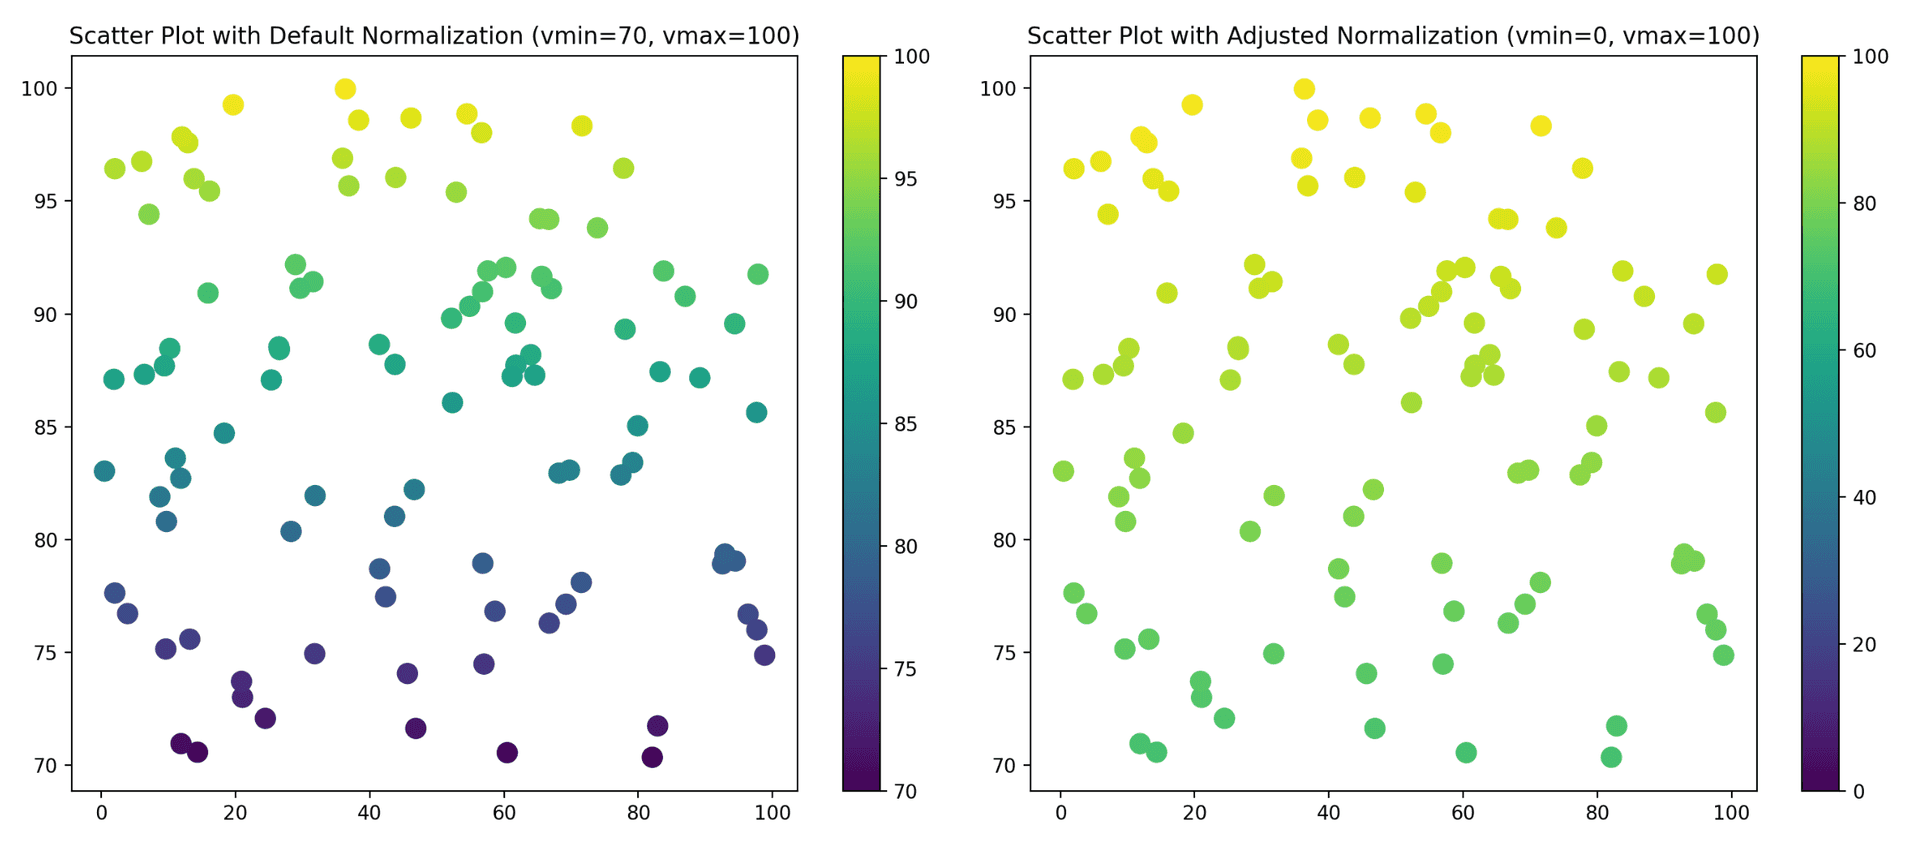
Matplotlib provides a wide range of colormaps but also a specific way of working with them. This post will show you how to use colormaps in Matplotlib to enhance the readability of your plots.
6️⃣ Creating your own palette
If you're not satisfied with the 2500+ options offered in the previous sections, you can still create your own palette from scratch.
We've built a full post on the topic, but here is a summary:
Matplotlib provides a few tools that, based on a list of colors create a colormap with it. You can createboth categorical and continuous palettes.
🚨 Grab the Data To Viz poster!
Do you know all the chart types? Do you know which one you should pick? I made a decision tree that answers those questions. You can download it for free!

