Pypalettes
PyPalettes is a python library that provides more than 2500 different palettes to use in your data visualization. It comes with a very simple-to-use API that only requires 1 line of code.
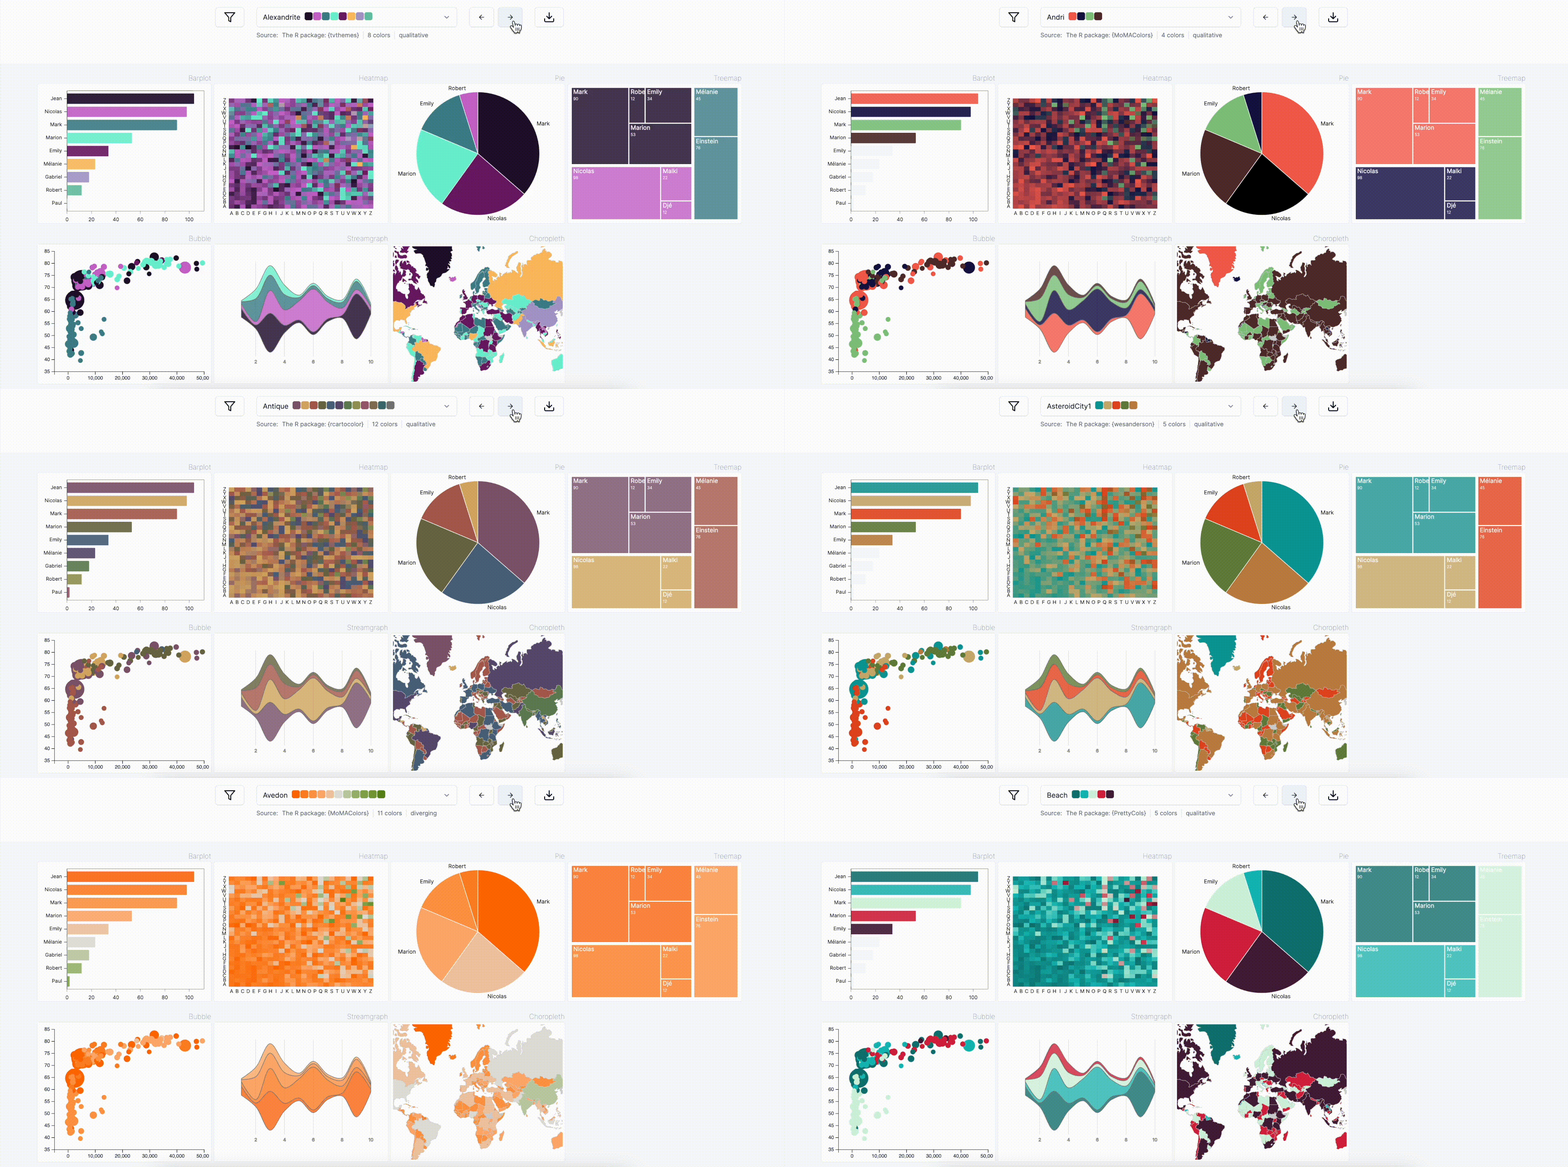
You can find your dream palette on the dedicated web app that highlights how palettes look like on different kind of charts.
You can install it by running pip install pypalettes in your terminal!
Quick start
The easiest way to get started is to load the load_cmap() function from pypalettes.
Here is an example with the Coconut palette.
import geopandas as gpd
import matplotlib.pyplot as plt
from pypalettes import load_cmap, load_palette

# load the dataset
df = gpd.read_file(
    "https://raw.githubusercontent.com/holtzy/The-Python-Graph-Gallery/master/static/data/all_world.geojson"
)
df = df[df["name"] != "Antarctica"]

cmap = load_cmap("Coconut")

# display the world map
fig, ax = plt.subplots(figsize=(10, 10), dpi=300)
ax.set_axis_off()
df.plot(ax=ax, cmap=cmap, edgecolor="white", linewidth=0.3)
plt.show()
Load and use a colormap
If you want to customise your palettes, the load_cmap() function is there to help you and has lots of options. Let's see how to use it in practice.
from pypalettes import load_cmap

cmap = load_cmap("ClaudeMonet")
cmap
We can then use this cmap object for a graph:
import matplotlib.pyplot as plt
import numpy as np

data = np.random.randn(20, 20)

plt.imshow(data, cmap=cmap)
plt.colorbar()
plt.show()
As you can see, the cmap is discrete: it has a fixed number of colors, visible via the color bar on the right. What if we want a color gradient instead? Simply add the cmap_type=‘continuous’ (the default is ‘discrete’) when you load the cmap:
from pypalettes import load_cmap

cmap = load_cmap("ClaudeMonet", cmap_type="continuous")
cmap
If we recreate the previous graph:
plt.imshow(data, cmap=cmap)
plt.colorbar()
plt.show()
Much better!
Now let's see how far you can go when customizing your palette. The load_cmap() function provides a set of arguments for this purpose.
load_cmap("FridaKahlo")reverse: Whether to reverse the order of the colors or not
load_cmap("FridaKahlo", reverse=True)keep_first_n: Keep only the first n colors of the palette
load_cmap("FridaKahlo", keep_first_n=3)keep: Specify which colors to keep in the palette (via a list of booleans)
load_cmap("FridaKahlo", keep=[True, False, False, True, True])repeat: The number of times the palette must be present in the output. Used to access larger palettes that are repeated.
load_cmap("FridaKahlo", repeat=3)shuffle: Used to mix the order of colors. If an integer is supplied, it will be used as the seed.
load_cmap("FridaKahlo", shuffle=1)Cmap attributes
When you load a cmap, you load a matplotlib object with extended attributes. You can access, for each palette,
- the associated colors using
load_palette() - the kind of the palette
- the name of the palette
- the source of the palette
cmap = load_cmap("Acadia")
palette = load_palette("Acadia")

cmap
palette['#FED789FF', '#023743FF', '#72874EFF', '#476F84FF', '#A4BED5FF', '#453947FF']cmap.name'Acadia'cmap.source'The R package: {nationalparkcolors}'cmap.kind'qualitative'Make your own
PyPalettes also provides a basic tool for creating and registering color maps in matplotlib: the add_cmap() function.
This function does 2 things: it registers your function so that your cmap is now available natively in matplotlib, and it returns the cmap object to you. For example:
from pypalettes import create_cmap

cmap = create_cmap(
    colors=["#D57A6DFF", "#E8B762FF", "#9CCDDFFF", "#525052FF"],
    cmap_type="continuous",
)
We can now use cmap for our charts:
import matplotlib.pyplot as plt
import numpy as np

x = np.linspace(0, 20, 1000)
y = np.sin(x)

plt.scatter(x, y, c=y, cmap=cmap)
plt.colorbar()
plt.show()
Bonus & tips
- Palettes can be combined if you provide a list of palette names:
load_cmap(["Joyful", "Juarez", "Kandinsky"])- If you use
load_cmap()with no arguments (or with the name‘random’), it will load a random one:
load_cmap()- Can't remember the exact name of your favorite palette? Simply try out what you have in mind and it will suggest similar palettes:
load_cmap("fridaqallo")ValueError: Palette with name 'fridaqallo' not found. Did you mean: FridaKahlo, Frida, marill, dracomalfoy, taillow?
See available palettes at https://python-graph-gallery.com/color-palette-finder/
Going further
Palette finder
Browse the color palette finder to find your dream palette!

Related
- the colors section of the gallery
- the github repository of
PyPalettes


