What Matplotlib interprets as a color
In matplotlib, you can specify colors in a variety of ways:
- as a string representing a color name (e.g.,
redorblue), but only a limited number of colors are supported this way - as a string representing a hexadecimal color code (e.g.,
#FF0000or#e9edc9), which allows you to specify any color - as a string representing an RGB or RGBA tuple (e.g.,
(1, 0, 0)or(0.9, 0.9, 0.8, 1)), which also allows you to specify any color. RGB stands for Red, Green, Blue, and RGBA stands for Red, Green, Blue, Alpha (the alpha channel specifies the transparency of the color).
Let's see how these different ways of specifying colors work in practice.
import matplotlib.pyplot as plt
import numpy as np

random_data = np.random.randn(1000)

# Create a figure and a set of 4 subplots
fig, axs = plt.subplots(nrows=2, ncols=2, figsize=(10, 10), dpi=200)

# Hexadecimal color codes
color = "#FF5733"
axs[0,0].hist(
    random_data,
    bins=30,
    density=True,
    color=color
)
axs[0,0].set_title(f"color = {color}")

# Pre-defined color names
color = "skyblue"
axs[0,1].hist(
    random_data,
    bins=30,
    density=True,
    color=color
)
axs[0,1].set_title(f"color = {color}")

# RGB tuple
color = (0.1, 0.2, 0.5)
axs[1,0].hist(
    random_data,
    bins=30,
    density=True,
    color=color
)
axs[1,0].set_title(f"color = {color}")

# RGBA tuple
color = (0.1, 0.2, 0.5, 0.4)
axs[1,1].hist(
    random_data,
    bins=30,
    density=True,
    color=color
)
axs[1,1].set_title(f"color = {color}")

plt.show()
Available color names
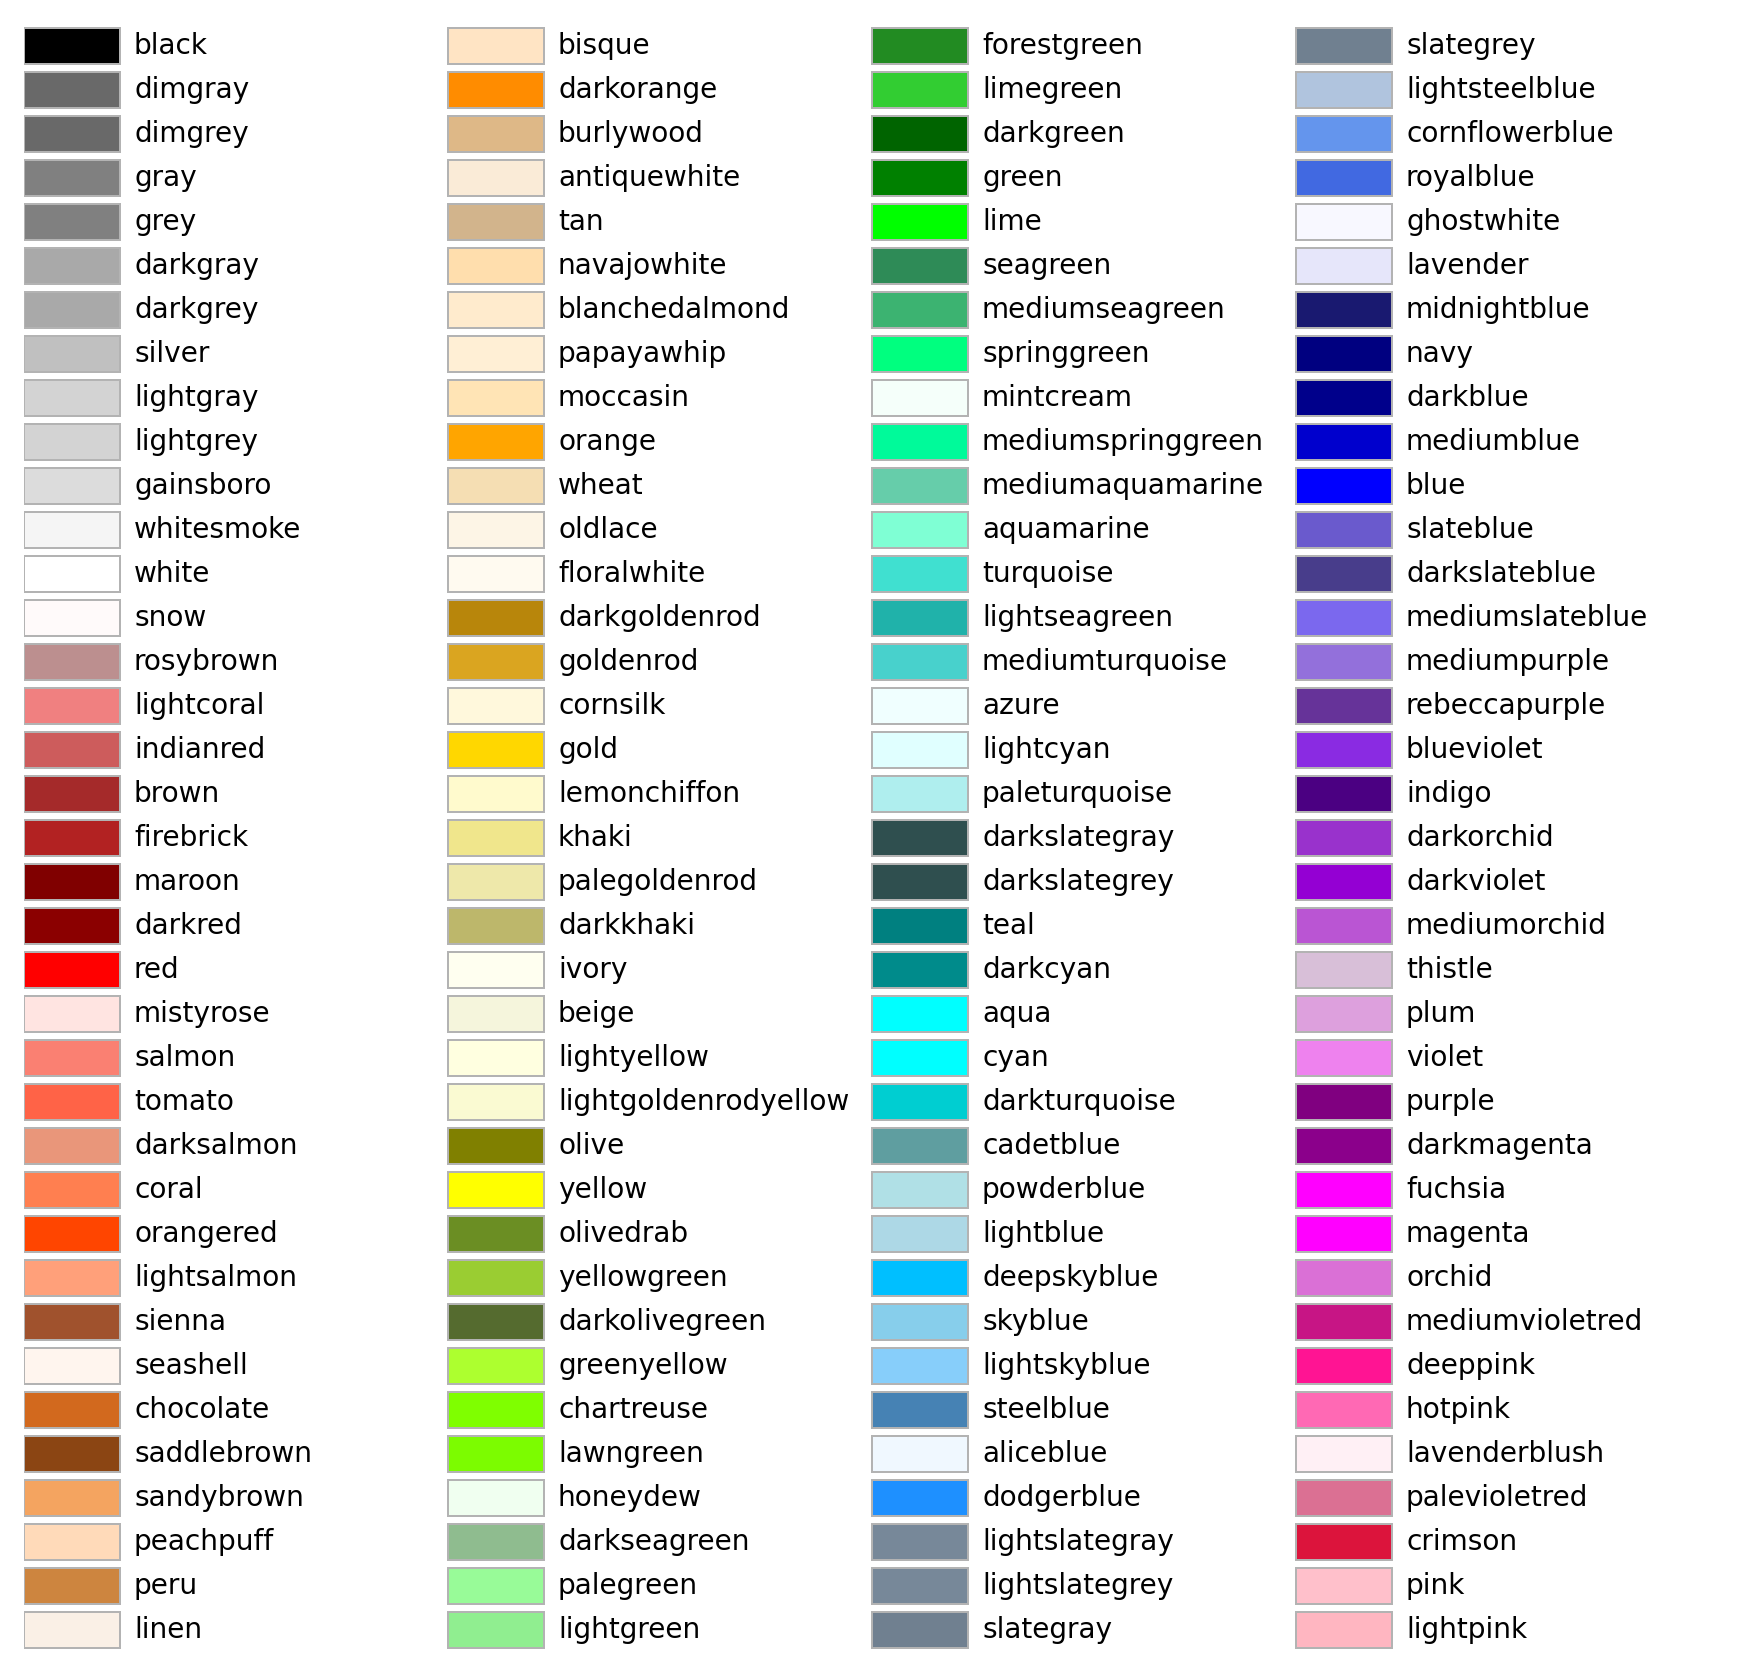
Matplotlib supports a limited number of color names. You can see the full list of supported color names below.

Short color names
Matplotlib also supports a few short color names. You can see the full list of supported short color names below.

Going further
Palette finder
Browse the color palette finder to find your dream palette!

Related
- the color section of the gallery
- discover the categorical palettes and continuous palettes in Matplotlib


