About
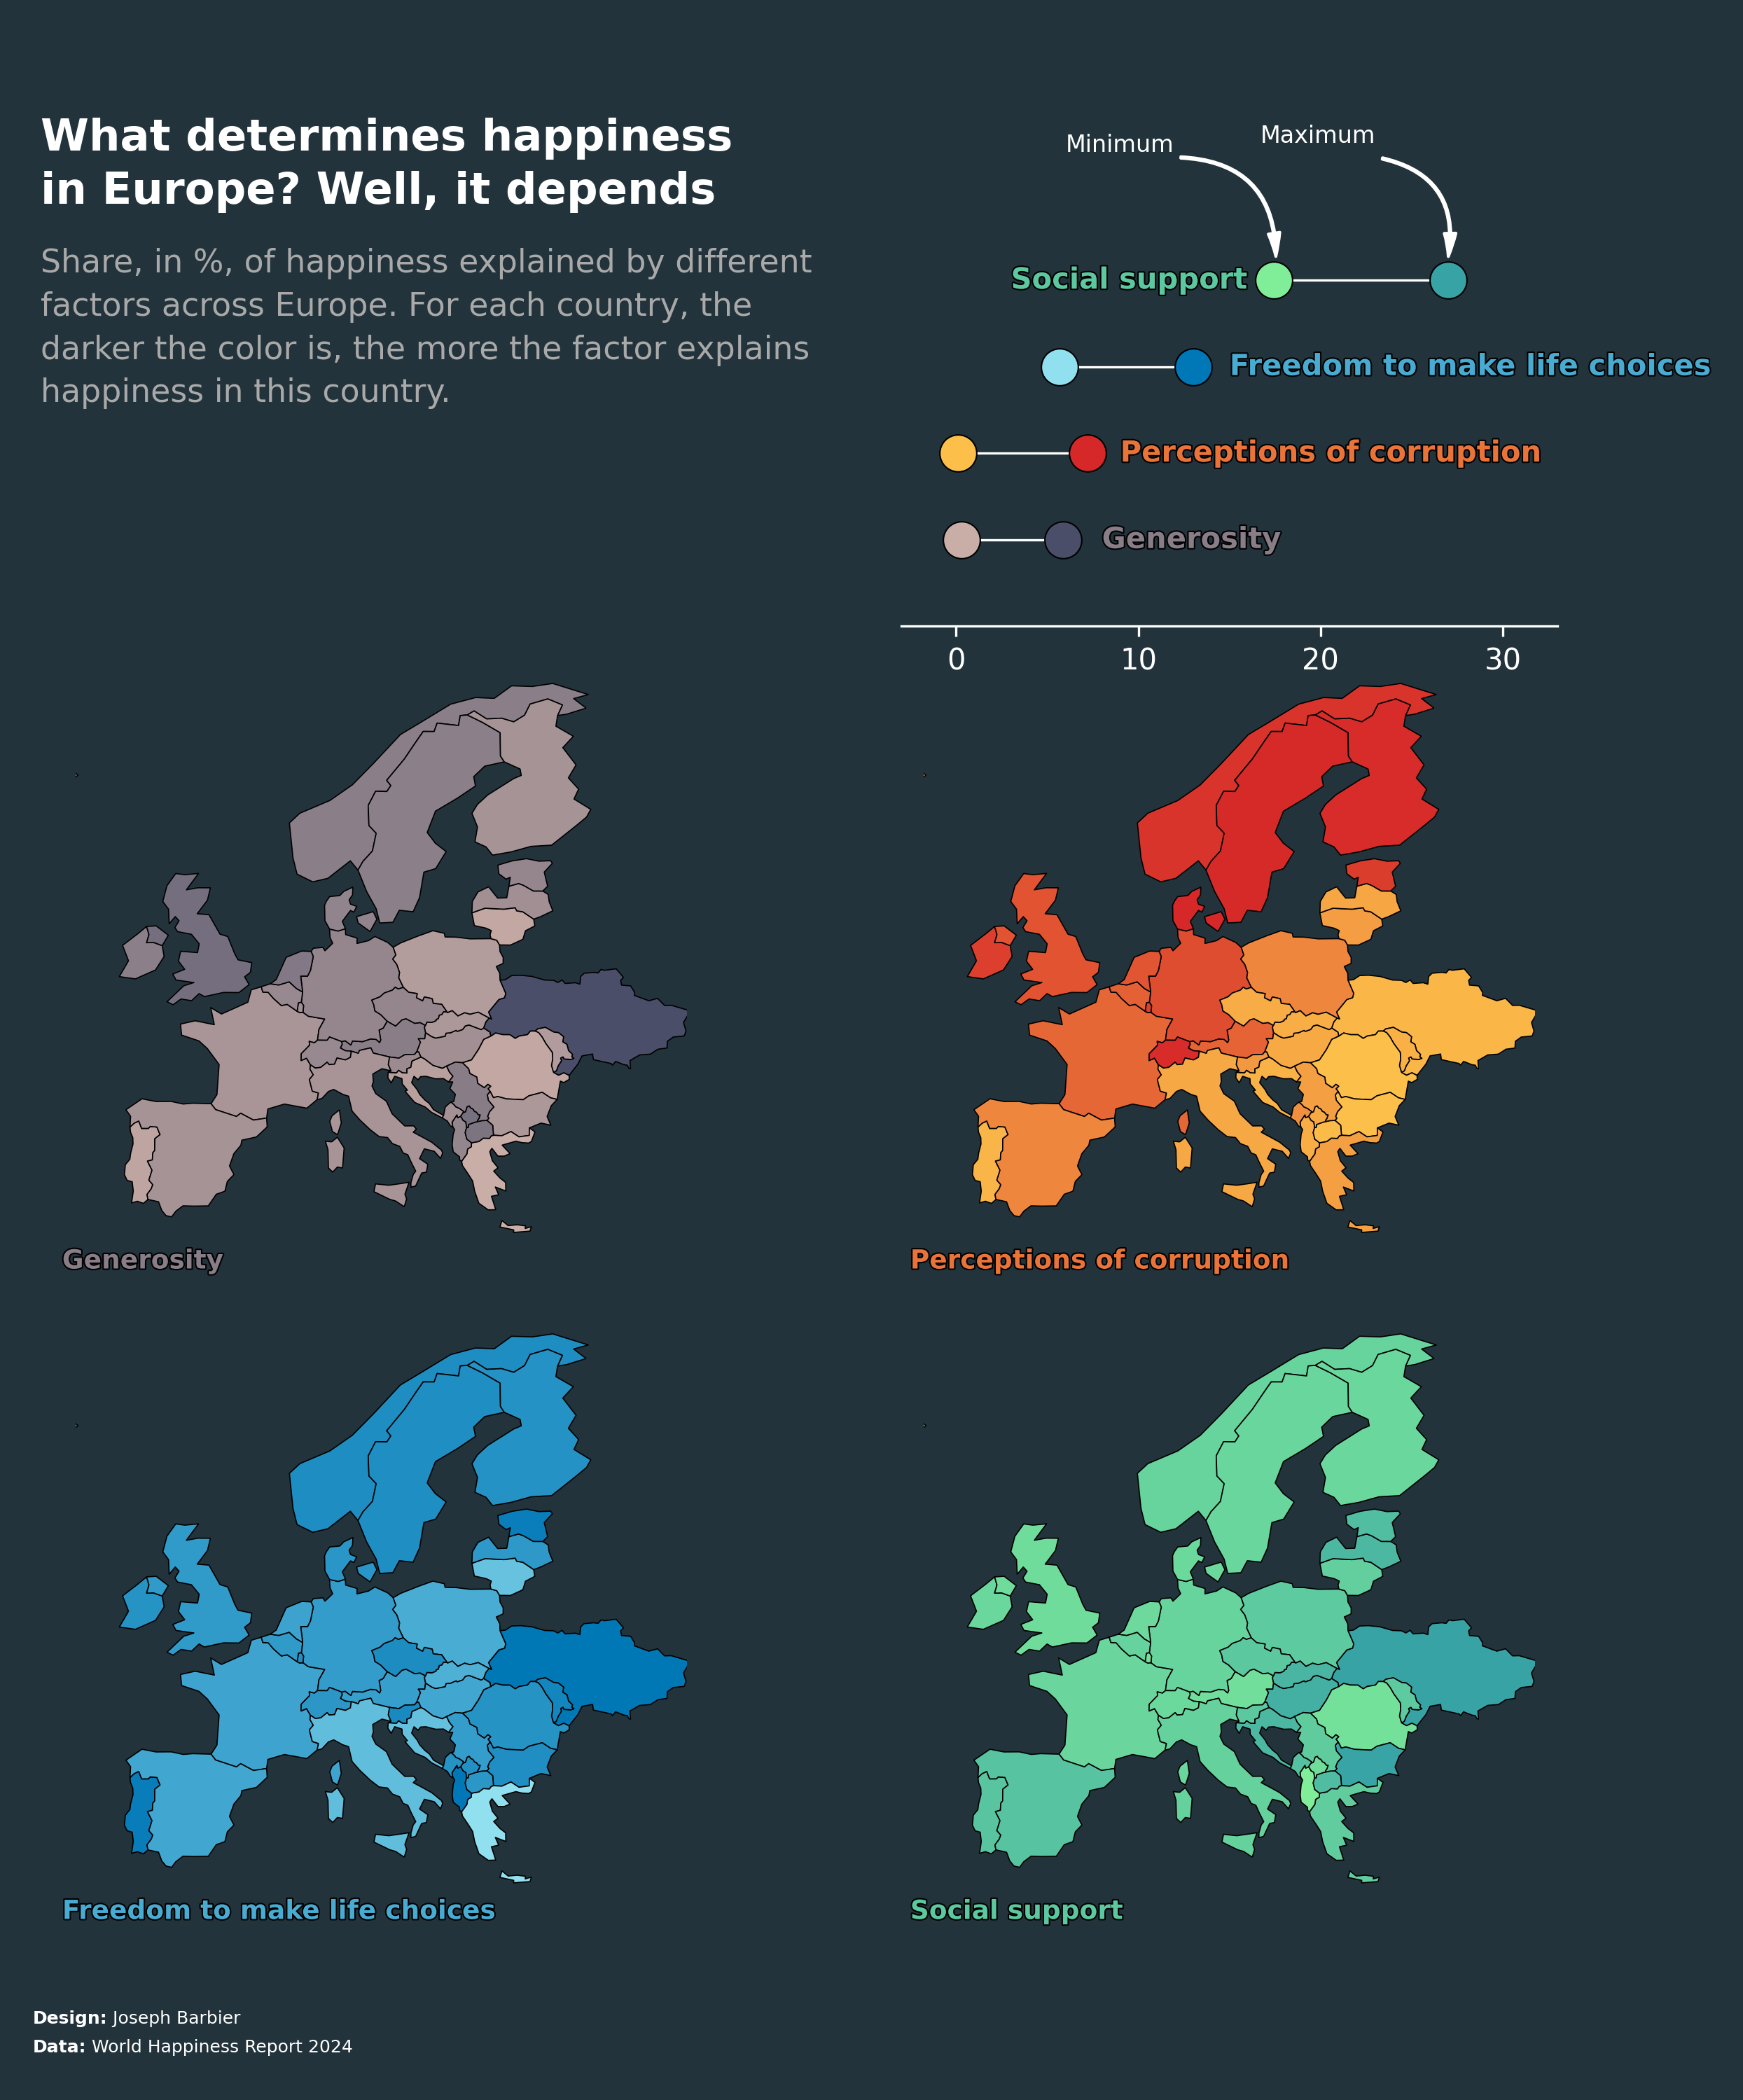
This plot is a combination of multiple choropleth maps, with a lollipop plot as a legend. It shows the share of explained happiness of different factors across Europe.
The chart was made by Joseph B. Thanks to him for accepting sharing his work here!
Let's see what the final picture will look like:
Libraries
First, you need to load a whole bunch of libraries:
# data
import pandas as pd
import geopandas as gpd

# plotting
import matplotlib.pyplot as plt
from matplotlib.colors import LinearSegmentedColormap

# annotations
import matplotlib.patches as patches
from matplotlib.patches import FancyArrowPatch
from highlight_text import ax_text, fig_text
import matplotlib.patheffects as path_effects
Dataset
For this reproduction, we're going to retrieve the data directly from the gallery's Github repo. This means we just need to give the right url as an argument to pandas' read_csv() function to retrieve the data.
The dataset contains one row per country and its associated value. The dataset has been transformed a bit, but you can find the original data here.
Note: the geometry column is used to create the shape of the countries on the map.
# Open the dataset from Github
url = "https://raw.githubusercontent.com/holtzy/the-python-graph-gallery/master/static/data/WHRreport2024.csv"
df = pd.read_csv(url)

# open and merge with geo data
world = gpd.read_file(
    "../../static/data/ne_110m_admin_0_countries/ne_110m_admin_0_countries.shp"
)
europe = world[world['CONTINENT'] == 'Europe']
data = europe.merge(
    df, how='left',
    left_on='NAME',
    right_on='Country name'
)
data = data[['geometry']+df.columns.to_list()]
data.dropna(inplace=True)
data.head(3)| geometry | Country name | Ladder score | upperwhisker | lowerwhisker | Dystopia + residual | Log GDP per capita | Social support | Healthy life expectancy | Freedom to make life choices | Generosity | Perceptions of corruption | share_Dystopia + residual | share_Log GDP per capita | share_Social support | share_Healthy life expectancy | share_Freedom to make life choices | share_Generosity | share_Perceptions of corruption | |
|---|---|---|---|---|---|---|---|---|---|---|---|---|---|---|---|---|---|---|---|
| 1 | MULTIPOLYGON (((15.14282 79.67431, 15.52255 80... | Norway | 7.302 | 7.389 | 7.215 | 1.586 | 1.952 | 1.517 | 0.704 | 0.835 | 0.224 | 0.484 | 21.720077 | 26.732402 | 20.775130 | 9.641194 | 11.435223 | 3.067653 | 6.628321 |
| 2 | MULTIPOLYGON (((-51.65780 4.15623, -52.24934 3... | France | 6.609 | 6.685 | 6.533 | 1.672 | 1.818 | 1.348 | 0.727 | 0.650 | 0.112 | 0.281 | 25.298835 | 27.507944 | 20.396429 | 11.000151 | 9.835073 | 1.694659 | 4.251778 |
| 3 | POLYGON ((11.02737 58.85615, 11.46827 59.43239... | Sweden | 7.344 | 7.422 | 7.267 | 1.658 | 1.878 | 1.501 | 0.724 | 0.838 | 0.221 | 0.524 | 22.576253 | 25.571895 | 20.438453 | 9.858388 | 11.410675 | 3.009259 | 7.135076 |
Initiate the maps
We start by creating a figure with 3 rows and 2 columns.
Then, we add the maps, with default colors on the last 4 axes.
def plot_map_on_ax(column, ax):
    """
    Add a map on a given axis
    """
    data.plot(
        column=column,
        edgecolor='black', linewidth=0.4,
        ax=ax
    )
    ax.set_xlim(-13.8, 40)
    ax.set_ylim(32, 72)
    ax.axis('off')


# initialize the figure
fig, axs = plt.subplots(nrows=3, ncols=2, figsize=(8, 10))
axs = axs.flatten()

# list that we use to display maps,
# with empty values for 2 first axes
columns = [
    '', '',
    'share_Generosity',
    'share_Perceptions of corruption',
    'share_Freedom to make life choices',
    'share_Social support'
]
for i, (ax, column) in enumerate(zip(axs, columns)):

    # skip first two axes (on top of the maps)
    if i in [0, 1]:
        continue

    # add map on the current axe
    plot_map_on_ax(column=column, ax=ax)

# display chart
plt.tight_layout()
plt.show()
Custom colors
For this chart, we define a colors dictionnary that contains column names as keys, and a list of 2 colors as values. We do so in order to then create colormaps (or cmap) based on those colors, thanks to the create_gradient_colormap() function, defined below.
We also use the set_facecolor() to change background color of the figure and the lollipop axe. The first axe does not need it since it will be completly removed in the next step and will have the figure color as well.
def create_gradient_colormap(colors):
    """
    Based on 2 color input, create a colormap of it.
    """
    cmap = LinearSegmentedColormap.from_list("custom_gradient", colors, N=256)
    return cmap


def plot_map_on_ax(column, ax, cmap):
    """
    Add a map on a given axis.
    """
    data.plot(
        column=column,
        cmap=cmap,
        edgecolor='black', linewidth=0.4,
        ax=ax
    )
    ax.set_xlim(-13.8, 40)
    ax.set_ylim(32, 72)
    ax.axis('off')


# colors for the chart
colors = {
    'share_Generosity': ['#c9ada7', '#4a4e69'],
    'share_Perceptions of corruption': ['#fcbf49', '#d62828'],
    'share_Freedom to make life choices': ['#90e0ef', '#0077b6'],
    'share_Social support': ['#80ed99', '#38a3a5'],
}
background_col = '#22333b'

# initialize the figure
fig, axs = plt.subplots(nrows=3, ncols=2, figsize=(8, 10))
axs = axs.flatten()

# set background color
fig.set_facecolor(background_col)
axs[1].set_facecolor(background_col)

# list that we use to display maps,
# with empty values for 2 first axes
columns = [
    '', '',
    'share_Generosity',
    'share_Perceptions of corruption',
    'share_Freedom to make life choices',
    'share_Social support'
]
for i, (ax, column) in enumerate(zip(axs, columns)):

    # skip first two axes (on top of the maps)
    if i in [0, 1]:
        continue

    # create a colormap based on colors
    cmap = create_gradient_colormap(colors[column])

    # add map on the current axe
    plot_map_on_ax(column=column, ax=ax, cmap=cmap)

# display chart
plt.tight_layout()
plt.show()
Add lollipop plot
Making a lollipop plot can be a bit tricky in matplotlib, especially when having points on both side.
For this, we use the scatter() function for the points and the hlines() function for the horizontal lines.
The positions are defined thanks to the min_max_df, defined in the code below. It contains one row per column (so 4 in total) and a column for the minimum value and one for the maximum.
def create_gradient_colormap(colors):
    """
    Based on 2 color input, create a colormap of it.
    """
    cmap = LinearSegmentedColormap.from_list("custom_gradient", colors, N=256)
    return cmap


def plot_map_on_ax(column, ax, cmap):
    """
    Add a map on a given axis.
    """
    data.plot(
        column=column,
        cmap=cmap,
        edgecolor='black', linewidth=0.4,
        ax=ax
    )
    ax.set_xlim(-13.8, 40)
    ax.set_ylim(32, 72)
    ax.axis('off')


# colors for the chart
colors = {
    'share_Generosity': ['#c9ada7', '#4a4e69'],
    'share_Perceptions of corruption': ['#fcbf49', '#d62828'],
    'share_Freedom to make life choices': ['#90e0ef', '#0077b6'],
    'share_Social support': ['#80ed99', '#38a3a5'],
}
background_col = '#22333b'

# initialize the figure
fig, axs = plt.subplots(nrows=3, ncols=2, figsize=(8, 10))
axs = axs.flatten()

# set background color
fig.set_facecolor(background_col)
axs[1].set_facecolor(background_col)

# list that we use to display maps,
# with empty values for 2 first axes
columns = [
    '', '',
    'share_Generosity',
    'share_Perceptions of corruption',
    'share_Freedom to make life choices',
    'share_Social support'
]
for i, (ax, column) in enumerate(zip(axs, columns)):

    # skip first two axes (on top of the maps)
    if i in [0, 1]:
        continue

    # create a colormap based on colors
    cmap = create_gradient_colormap(colors[column])

    # add map on the current axe
    plot_map_on_ax(column=column, ax=ax, cmap=cmap)

# Lollipop plot
min_max_df = data[columns[2:]].agg(['min', 'max']).T
for i, col in enumerate(columns[2:]):

    # colors
    min_color = colors[col][0]
    max_color = colors[col][1]

    # filter on current column
    subset = min_max_df.iloc[i].T

    # add data points of lollipop
    axs[1].scatter(subset['min'], i, zorder=2, s=160, edgecolor='black', linewidth=0.5, color=min_color)
    axs[1].scatter(subset['max'], i, zorder=2, s=160, edgecolor='black', linewidth=0.5, color=max_color)

# horizontal lines of lollipop
axs[1].hlines(
    y=range(4),
    xmin=min_max_df['min'], xmax=min_max_df['max'],
    color='white', linewidth=0.8, zorder=1
)

# custom lollipop axis features
axs[1].spines[['right', 'top', 'left']].set_visible(False)
axs[1].set_xticks([0, 10, 20, 30, 40])
axs[1].spines['bottom'].set_color('white')
axs[1].tick_params(axis='x', colors='white')
axs[1].set_yticks([])
axs[1].set_ylim(-1, 6)
axs[1].set_xlim(-3, 33)

# display chart
plt.tight_layout()
plt.show()
Title and description
The title (and the description) are displayed using the ax_text() function from the highlight_text package. For a dedicated explanation of how it works, check this post.
def create_gradient_colormap(colors):
    """
    Based on 2 color input, create a colormap of it.
    """
    cmap = LinearSegmentedColormap.from_list("custom_gradient", colors, N=256)
    return cmap

def plot_map_on_ax(column, ax, cmap):
    """
    Add a map on a given axis.
    """
    data.plot(
        column=column,
        cmap=cmap,
        edgecolor='black', linewidth=0.4,
        ax=ax
    )
    ax.set_xlim(-13.8, 40)
    ax.set_ylim(32, 72)
    ax.axis('off')

# colors for the chart
colors = {
    'share_Generosity': ['#c9ada7', '#4a4e69'],
    'share_Perceptions of corruption': ['#fcbf49', '#d62828'],
    'share_Freedom to make life choices': ['#90e0ef', '#0077b6'],
    'share_Social support': ['#80ed99', '#38a3a5'],
}
background_col = '#22333b'

# initialize the figure
fig, axs = plt.subplots(nrows=3, ncols=2, figsize=(8, 10))
axs = axs.flatten()

# set background color
fig.set_facecolor(background_col)
axs[1].set_facecolor(background_col)

# list that we use to display maps,
# with empty values for 2 first axes
columns = [
    '', '',
    'share_Generosity',
    'share_Perceptions of corruption',
    'share_Freedom to make life choices',
    'share_Social support'
]
for i, (ax, column) in enumerate(zip(axs, columns)):

    # skip first two axes (on top of the maps)
    if i in [0, 1]:
        continue

    # create a colormap based on colors
    cmap = create_gradient_colormap(colors[column])

    # add map on the current axe
    plot_map_on_ax(column=column, ax=ax, cmap=cmap)

# Lollipop plot
min_max_df = data[columns[2:]].agg(['min', 'max']).T
for i, col in enumerate(columns[2:]):

    # colors
    min_color = colors[col][0]
    max_color = colors[col][1]

    # filter on current column
    subset = min_max_df.iloc[i].T

    # add data points of lollipop
    axs[1].scatter(subset['min'], i, zorder=2, s=160, edgecolor='black', linewidth=0.5, color=min_color)
    axs[1].scatter(subset['max'], i, zorder=2, s=160, edgecolor='black', linewidth=0.5, color=max_color)

# horizontal lines of lollipop
axs[1].hlines(
    y=range(4),
    xmin=min_max_df['min'], xmax=min_max_df['max'],
    color='white', linewidth=0.8, zorder=1
)

# custom lollipop axis features
axs[1].spines[['right', 'top', 'left']].set_visible(False)
axs[1].set_xticks([0, 10, 20, 30, 40])
axs[1].spines['bottom'].set_color('white')
axs[1].tick_params(axis='x', colors='white')
axs[1].set_yticks([])
axs[1].set_ylim(-1, 6)
axs[1].set_xlim(-3, 33)

# remove top left axis
axs[0].set_axis_off()

# title and credit
text = """
<What determines happiness>
<in Europe? Well, it depends>


<Share, in %, of happiness explained by different>
<factors across Europe. For each country, the>
<darker the color is, the more the factor explains>
<happiness in this country.>
"""
ax_text(
    -0.02, 0.6,
    text,
    ha='left', va='center',
    fontsize=15,
    color='black',
    highlight_textprops=[
        {'fontweight': 'bold',
         'color': 'white'},
        {'fontweight': 'bold',
         'color': 'white'},

        {'color': 'darkgrey',
         'fontsize': 11},
        {'color': 'darkgrey',
         'fontsize': 11},
        {'color': 'darkgrey',
         'fontsize': 11},
        {'color': 'darkgrey',
         'fontsize': 11}
    ],
    ax=axs[0]
)

# display chart
plt.tight_layout()
plt.show()
Annotations
Similar to the title, the annotations are displayed using the ax_text() and fig_text() function from the highlight_text package.
The arrows are displayed using FancyArrowPatch() function from matplotlib. We define a draw_arrow() function in order to make the code a bit easier to read when adding arrows. It just needs tail and head positions to add arrows on the figure.
def create_gradient_colormap(colors):
    """
    Based on 2 color input, create a colormap of it.
    """
    cmap = LinearSegmentedColormap.from_list("custom_gradient", colors, N=256)
    return cmap

def draw_arrow(tail_position, head_position, fig, invert=False):
    """
    Draw a curve arrow at given tail/head position, on a figure.
    """
    kw = dict(
        arrowstyle="Simple, tail_width=0.5, head_width=4, head_length=8", color="white")
    if invert:
        connectionstyle = "arc3,rad=-.5"
    else:
        connectionstyle = "arc3,rad=.5"
    a = FancyArrowPatch(tail_position, head_position,
                        connectionstyle=connectionstyle,
                        transform=fig.transFigure,
                        **kw)
    fig.patches.append(a)

def plot_map_on_ax(column, ax, cmap):
    """
    Add a map on a given axis.
    """
    data.plot(
        column=column,
        cmap=cmap,
        edgecolor='black', linewidth=0.4,
        ax=ax
    )
    ax.set_xlim(-13.8, 40)
    ax.set_ylim(32, 72)
    ax.axis('off')

def path_effect_stroke(**kwargs):
    return [path_effects.Stroke(**kwargs), path_effects.Normal()]
pe = path_effect_stroke(linewidth=1, foreground="black")

# colors for the chart
colors = {
    'share_Generosity': ['#c9ada7', '#4a4e69'],
    'share_Perceptions of corruption': ['#fcbf49', '#d62828'],
    'share_Freedom to make life choices': ['#90e0ef', '#0077b6'],
    'share_Social support': ['#80ed99', '#38a3a5'],
}
background_col = '#22333b'

# initialize the figure
fig, axs = plt.subplots(nrows=3, ncols=2, figsize=(8, 10))
axs = axs.flatten()

# set background color
fig.set_facecolor(background_col)
axs[1].set_facecolor(background_col)

# list that we use to display maps,
# with empty values for 2 first axes
columns = [
    '', '',
    'share_Generosity',
    'share_Perceptions of corruption',
    'share_Freedom to make life choices',
    'share_Social support'
]

# annotation positions on the lollipop
annotations_pos = [
    '', '',
    [8, 0],
    [9, 1],
    [15, 2],
    [3, 3]
]

# iterate over of the 6 axes AND column names
for i, (ax, column) in enumerate(zip(axs, columns)):

    # skip first two axes (on top of the maps)
    if i in [0, 1]:
        continue

    # create a colormap based on colors
    cmap = create_gradient_colormap(colors[column])

    # add map on the current axe
    plot_map_on_ax(column=column, ax=ax, cmap=cmap)

    # annotations below each map
    ax_text(
        -15, 33, # fixed position for each map
        '<'+column[6:]+'>',
        ha='left', va='center',
        fontsize=9, fontweight='bold',
        color=cmap(0.5),
        highlight_textprops=[
            {"path_effects": pe}
        ], ax=ax
    )

    # annotations on lollipop
    x, y = annotations_pos[i]
    ax_text(
        x, y,
        '<'+column[6:]+'>',
        ha='left', va='center',
        fontweight='bold',
        fontsize=10,
        color=cmap(0.5),
        highlight_textprops=[
            {"path_effects": pe}
        ], ax=axs[1]
    )

# Lollipop plot
min_max_df = data[columns[2:]].agg(['min', 'max']).T
for i, col in enumerate(columns[2:]):

    # colors
    min_color = colors[col][0]
    max_color = colors[col][1]

    # filter on current column
    subset = min_max_df.iloc[i].T

    # add data points of lollipop
    axs[1].scatter(subset['min'], i, zorder=2, s=160, edgecolor='black', linewidth=0.5, color=min_color)
    axs[1].scatter(subset['max'], i, zorder=2, s=160, edgecolor='black', linewidth=0.5, color=max_color)

# horizontal lines of lollipop
axs[1].hlines(
    y=range(4),
    xmin=min_max_df['min'], xmax=min_max_df['max'],
    color='white', linewidth=0.8, zorder=1
)

# custom lollipop axis features
axs[1].spines[['right', 'top', 'left']].set_visible(False)
axs[1].set_xticks([0, 10, 20, 30, 40])
axs[1].spines['bottom'].set_color('white')
axs[1].tick_params(axis='x', colors='white')
axs[1].set_yticks([])
axs[1].set_ylim(-1, 6)
axs[1].set_xlim(-3, 33)

# remove top left axis
axs[0].set_axis_off()

# title and credit
text = """
<What determines happiness>
<in Europe? Well, it depends>


<Share, in %, of happiness explained by different>
<factors across Europe. For each country, the>
<darker the color is, the more the factor explains>
<happiness in this country.>
"""
ax_text(
    -0.02, 0.6,
    text,
    ha='left', va='center',
    fontsize=15,
    color='black',
    highlight_textprops=[
        {'fontweight': 'bold',
         'color': 'white'},
        {'fontweight': 'bold',
         'color': 'white'},

        {'color': 'darkgrey',
         'fontsize': 11},
        {'color': 'darkgrey',
         'fontsize': 11},
        {'color': 'darkgrey',
         'fontsize': 11},
        {'color': 'darkgrey',
         'fontsize': 11}
    ],
    ax=axs[0]
)

# credit
text = """
<Design:> Joseph Barbier
<Data:> World Happiness Report 2024
"""
ax_text(
    -17.6, 25, text,
    ha='left', va='center',
    fontsize=6, color='white',
    highlight_textprops=[
        {'fontweight': 'bold'},
        {'fontweight': 'bold'},
    ], ax=axs[4]
)

# reduce size and change position of lollipop axe
axs[1].set_position([0.56, 0.68, 0.2, 0.1])

# legend arrows
draw_arrow((0.7, 0.92), (0.76, 0.87), fig=fig, invert=True)
draw_arrow((0.82, 0.92), (0.862, 0.87), fig=fig, invert=True)
ax_text(
    6, 4.7, 'Minimum',
    fontsize=8, color='white',
    ax=axs[1]
)
ax_text(
    16.7, 4.8, 'Maximum',
    fontsize=8, color='white',
    ax=axs[1]
)

plt.tight_layout()
fig.savefig('../../static/graph/web-multiple-maps.png', dpi=300, bbox_inches='tight')
plt.show()
Going further
This article explains how to reproduce a multiple choropleth maps with a lollipop plot for the legend.
You might be interested in
- reproducing a beautiful dumbell/lollipop chart
- how to create a fully customized choropleth map.