DrawArrow: drawing arrows for matplotlib made easy

DrawArrow is a library that allows to create arrows for your matplotlib charts with ease.
It was created by Joseph Barbier in order to create curved, straight, thin, large or bizarre arrows in matplotlib, in any color, width and style you like.
⏱ Quick start
Before using drawarrow you need to install it. This can easily be done with pip:
pip install drawarrowMatplotlib graphs have two main components:
- the figure (the overall graph)
- the axes (all the sub-graphs)
DrawArrow provides 2 simple functions:
fig_arrow(): draw an arrow on a matplotlib figureax_arrow(): draw an arrow on a matplotlib axes
You basically just have to specify the head and tail positions to have an arrow on your chart.
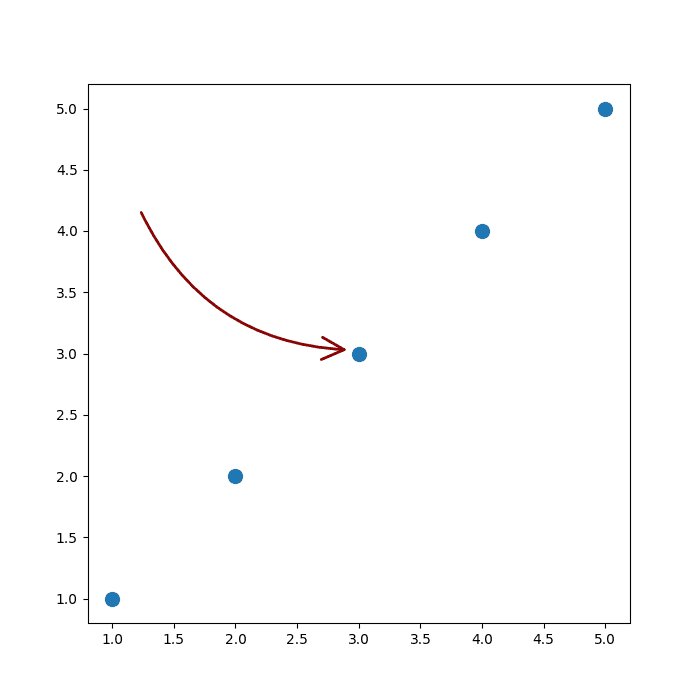
import matplotlib.pyplot as plt
from drawarrow import fig_arrow

fig, ax = plt.subplots()

ax.scatter(x=[1, 2, 3, 4, 5], y=[1, 2, 3, 4, 5], s=100)

fig_arrow(
    head_position=(0.5, 0.5),
    tail_position=(0.2, 0.7),
    width=2,
    radius=0.3,
    color="darkred",
    fill_head=False,
    mutation_scale=2,
)

plt.show()
🔎 fig_arrow() function parameters→ see full doc
→ Description
The fig_arrow() function of drawarrow add an arrow on a given matplotlib figure. All the arguments described here also work with the ax_arrow() function.
→ Arguments
Description
Array-like of length 2 specifying the tail position of the arrow on the figure.
Possible values → list
The first value is the x-axis position, and the second value is the y-axis position.
Code Example
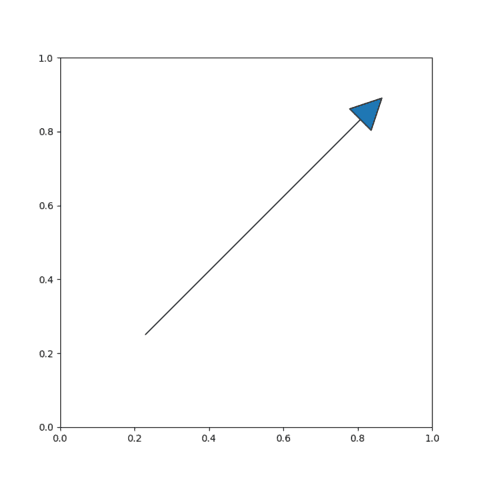
import matplotlib.pyplot as plt
from drawarrow import fig_arrow

fig, ax = plt.subplots()
fig_arrow(
  tail_position=[0.3, 0.3],
  head_position=[0.8, 0.8]
)

plt.show()Draw an arrow on an axes
Matplotlib graphs have two main components:
- the figure (the overall graph)
- the axes (all the sub-graphs)
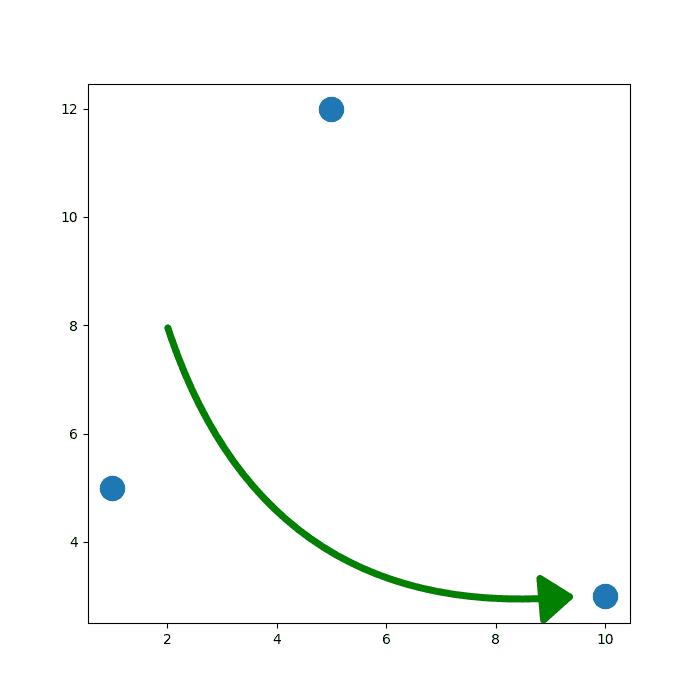
The ax_arrow() function is designed to draw arrows on an axes. It means that it's using the same coordinate system as the plotted data.
Most basic arrow with drawarrow
import matplotlib.pyplot as plt
from drawarrow import ax_arrow

fig, ax = plt.subplots(figsize=(7,7))

ax.scatter(x=[1, 5, 10], y=[5, 12, 3], s=300)
ax_arrow(
   tail_position=(2, 8),
   head_position=(9.5, 3),
   ax=ax,
   color="green",
   width=5,
   head_width=15,
   head_length=20,
   radius=0.4
)
plt.show()
Draw an arrow on a figure
Most basic arrow with drawarrow
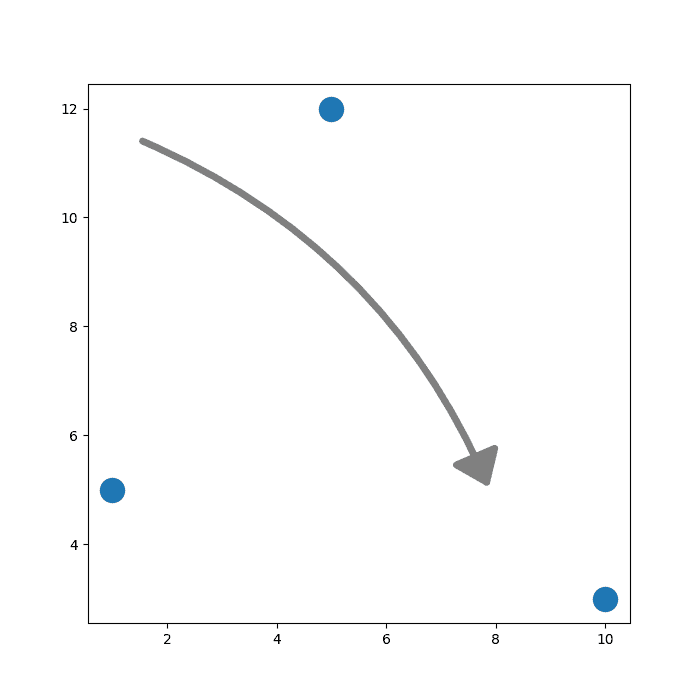
The fig_arrow() function is designed to draw arrows on a figure: using the relative coordinate system. The position (0,0) means the bottom left and (1,1) the top right of the figure
import matplotlib.pyplot as plt
from drawarrow import fig_arrow

fig, ax = plt.subplots(figsize=(7,7))

ax.scatter(x=[1, 5, 10], y=[5, 12, 3], s=300)
fig_arrow(
   tail_position=(0.2, 0.8),
   head_position=(0.7, 0.3),
   color="grey",
   width=5,
   head_width=15,
   head_length=20,
   radius=-0.2
)
plt.show()
Customize the arrow
The arrow displayed is a FancyArrowPatch, a specialized matplotlib object for creating complex arrows. You can pass any additional arguments for this object to fig_arrow() and ax_arrow().
The example below demonstrates some of the most useful options.
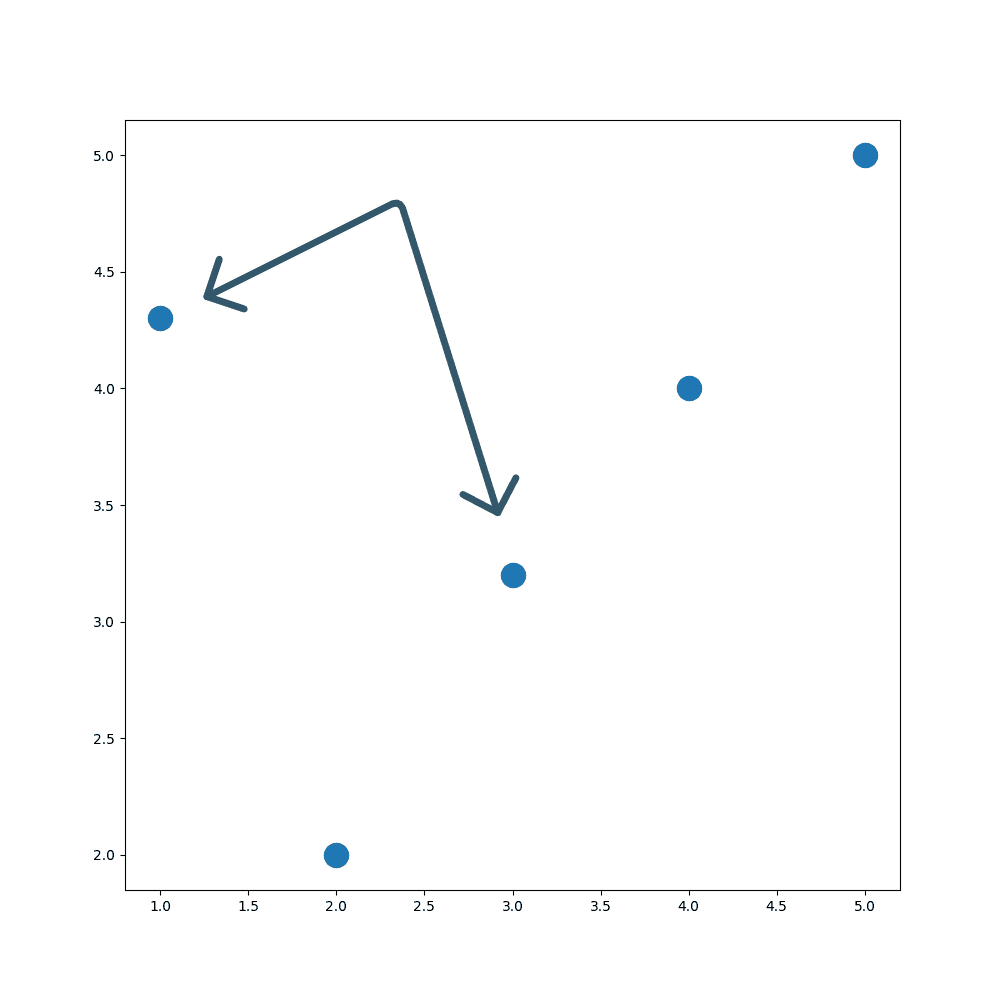
Most basic arrow with drawarrow
import matplotlib.pyplot as plt
from drawarrow import fig_arrow

fig, ax = plt.subplots(figsize=(10,10))

ax.scatter(x=[1, 2, 3, 4, 5], y=[4.3, 2, 3.2, 4, 5], s=300)

fig_arrow(
   tail_position=(0.2, 0.7),
   head_position=(0.5, 0.48),
   inflection_position=(0.4, 0.8),
   double_headed=True,
   fill_head=False,
   color="#003049",
   radius=0.1,
   alpha=0.8,
   width=5,
   head_width=10,
   head_length=10,
   mutation_scale=2
)

plt.show()
Gallery of examples
Here are some examples of what you can do with drawarrow. Click on the images to see the code.
Going further
You might be interested in
- the official github repo of drawarrow (⭐ give it a star!)
- how to draw an arrow with an inflection point
- how to create beautiful annotation in matplotlib
- how to work with different fonts in matplotlib
🚨 Grab the Data To Viz poster!
Do you know all the chart types? Do you know which one you should pick? I made a decision tree that answers those questions. You can download it for free!

