Cartogram

A cartogram is a map in which each region size is distorded according to a numeric variable. Python allows to draw this kind of map thanks to the Geopandas and Geoplot libraries
😔 Cartogram with Python
Unfortunately, there is no direct method to build cartograms in Python. However, if you need to create one, you can easily build cartograms in R using the cartogram package.
If you have implemented a cartogram algorithm in Python, please share your code with the community by opening an issue on the GitHub repository of the gallery.
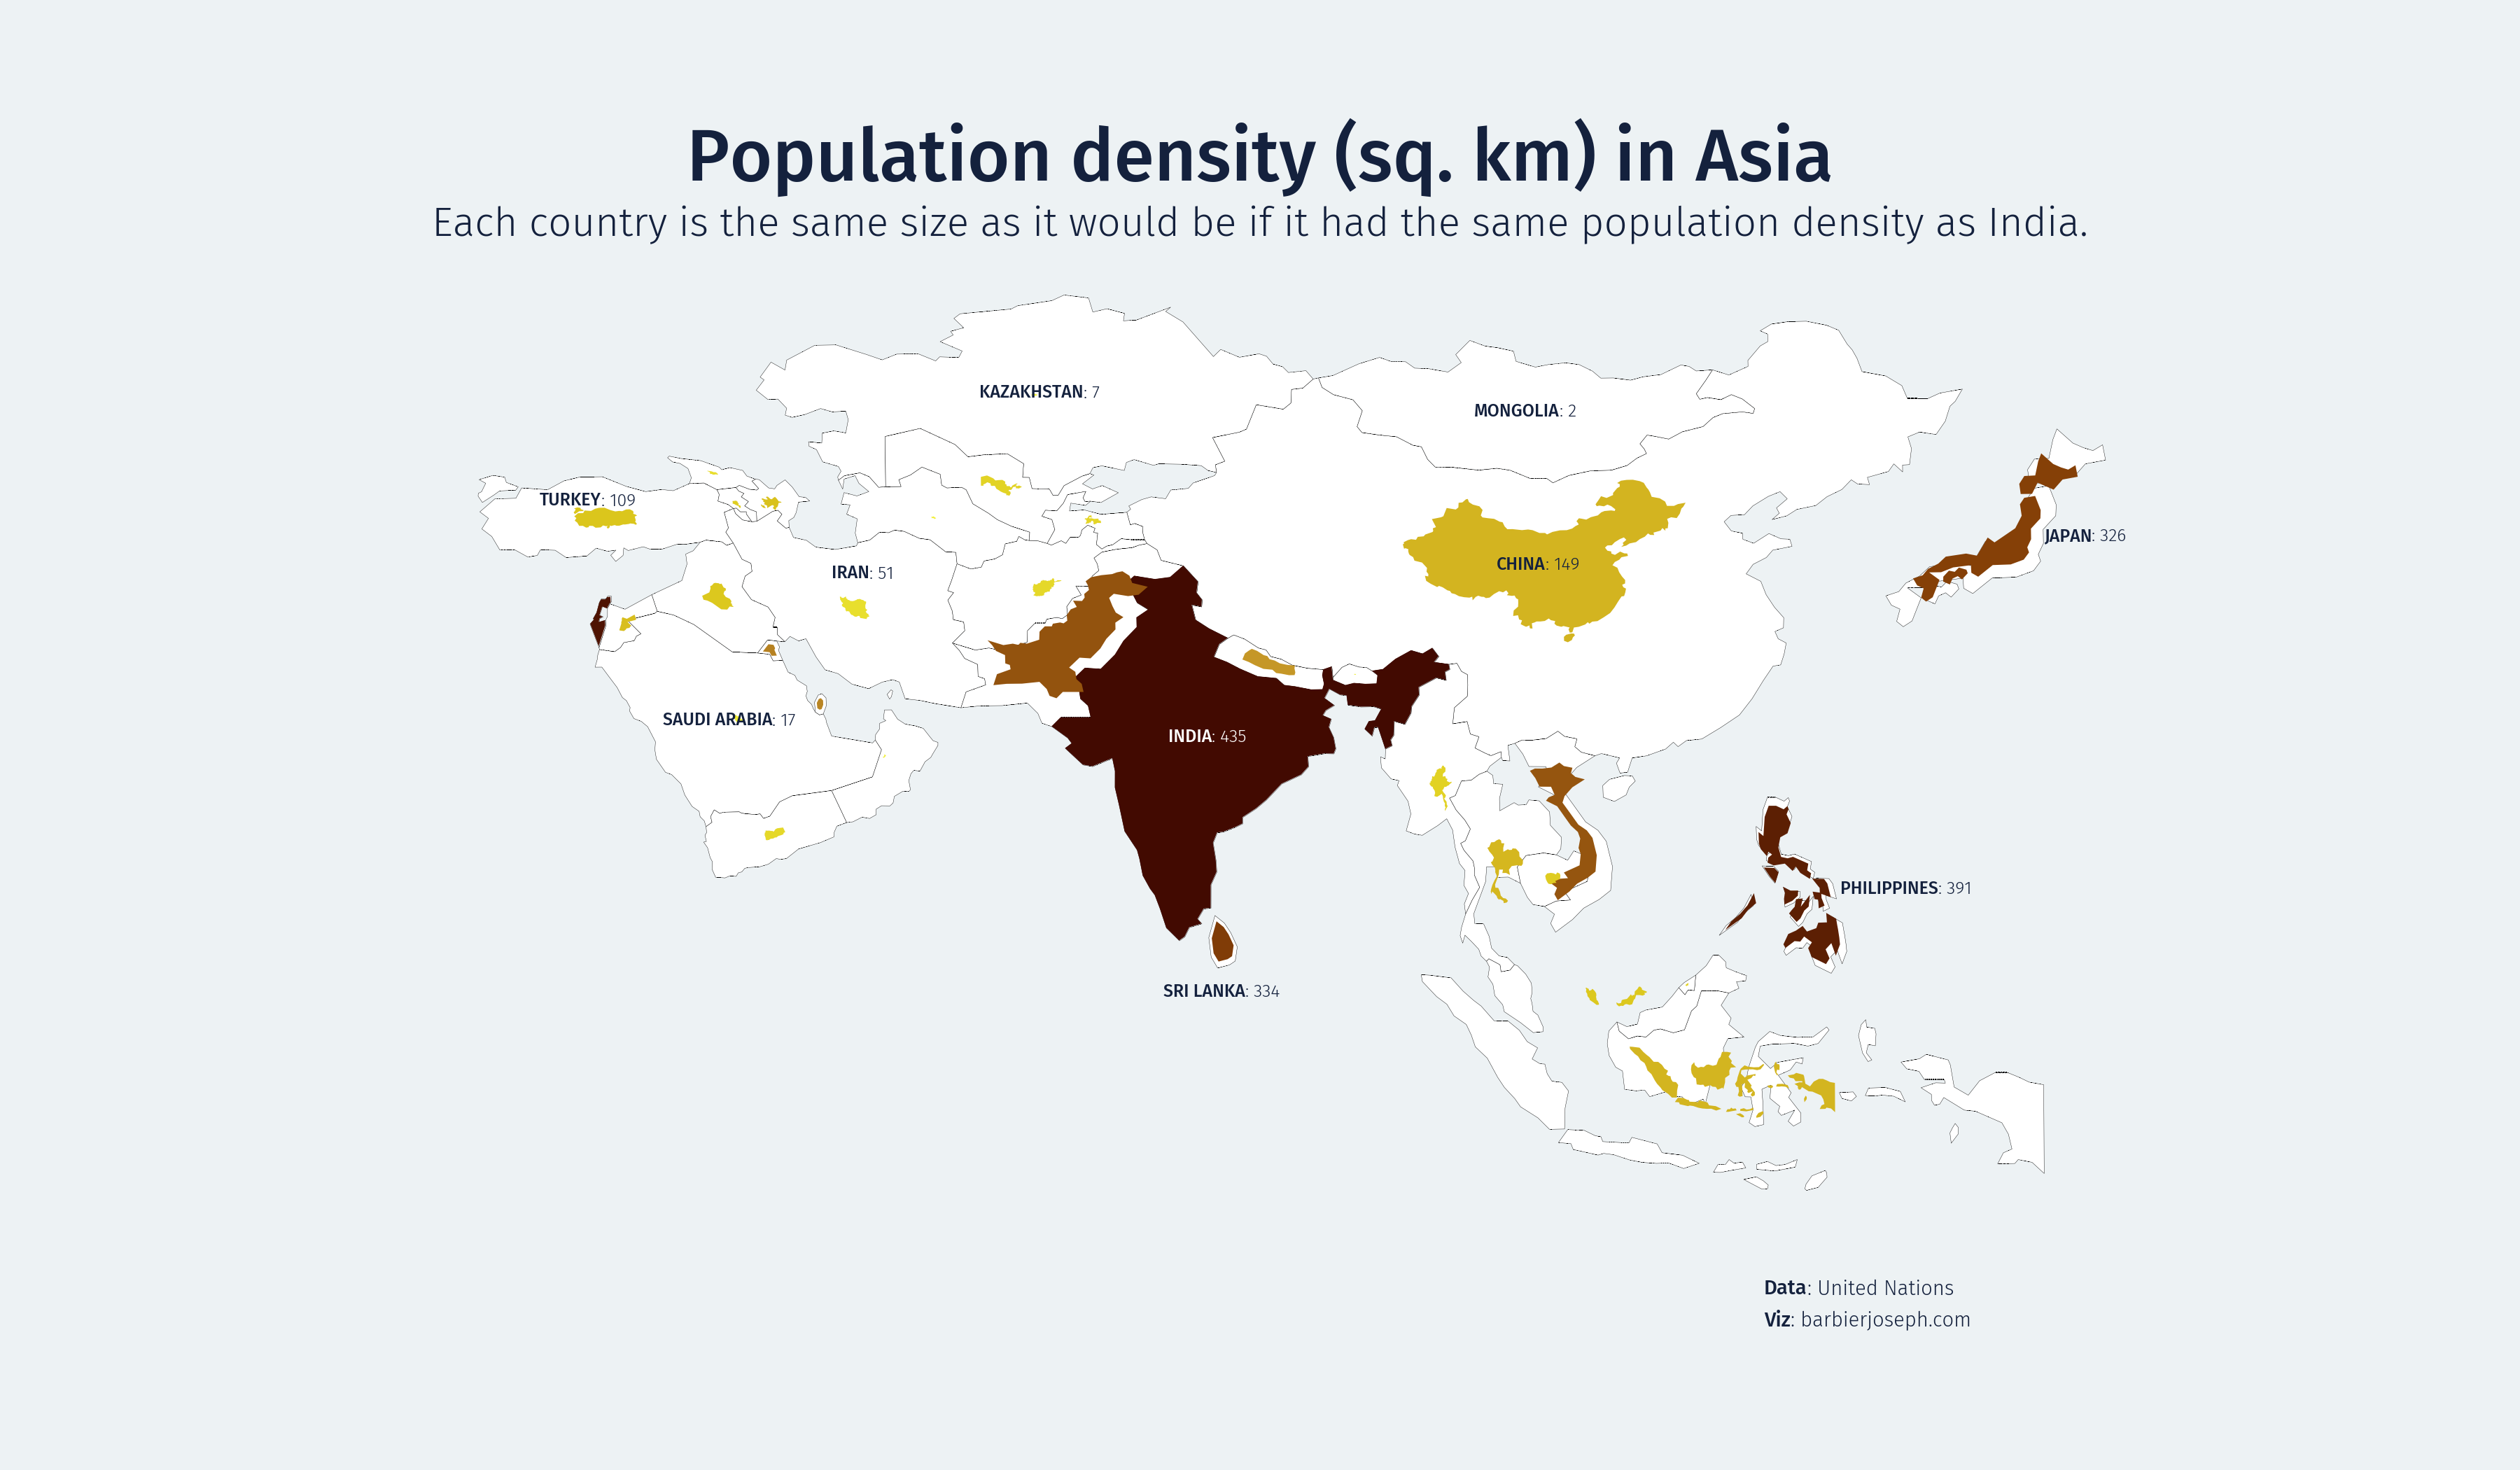
The only kind of cartogram implemented in Python is the non-contiguous cartogram that preserves shape but change size. And the good news is that we have a tuto on the Gallery!
Other kind of maps
The gallery provides numerous map examples for you to explore. Browse the examples below:


🚨 Grab the Data To Viz poster!
Do you know all the chart types? Do you know which one you should pick? I made a decision tree that answers those questions. You can download it for free!
