Hierarchical Edge Bundling

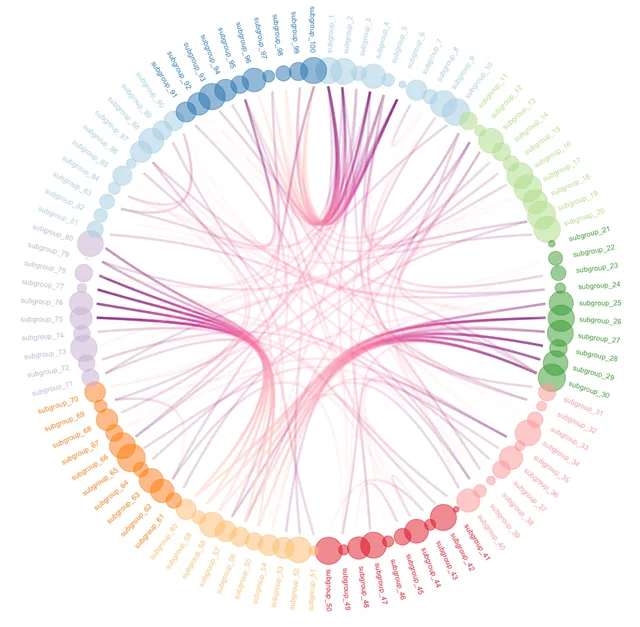
Hierarchical edge bundling allows to visualize adjacency relations between entities organized in a hierarchy. The idea is to bundle the adjacency edges together to decrease the clutter usually observed in complex networks.
😞 Sadness and Despair for Hierarchical Edge Bundling with Python.
As far as I know, there isn't any proper way to build a hierarchical edged bundling plot with python 😞. If you're aware of any tip to build it, please let me knwo! My contact is provided below 🙏🏽.
You now have 3 options!
- Use an alternative chart type. See the
related chartsection below. - Use
RorD3.jsinstead ofpython, links are provided below as well. - Build a Python library allowing to build them! I would love to share it here! 😊
Hierarchical Edge Bundling with R or Javascript
Contrary to python that is not of much help to build a hierarchical edge bundling, R and Javascript both offer built-in functions to make them. R will be more adapted if you're a data analyst and are happy with a static version. Javascript and the d3.js library offers more customization and interactivity options, but comes with a steeper learning curve and a lot of line of code. Pick your flavor!
Related chart types




💡 Out of dataviz inspiration?
I have spent years collecting the most beautiful data visualizations out there. Get the list of my top 300 dataviz projects, hand-picked, for free.
I respect your privacy. Unsubscribe anytime.