Basic Scatterplot with Defined Axis Limits
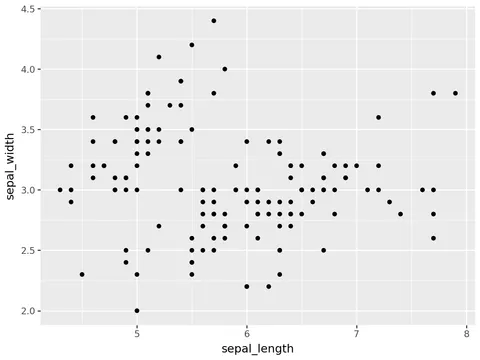
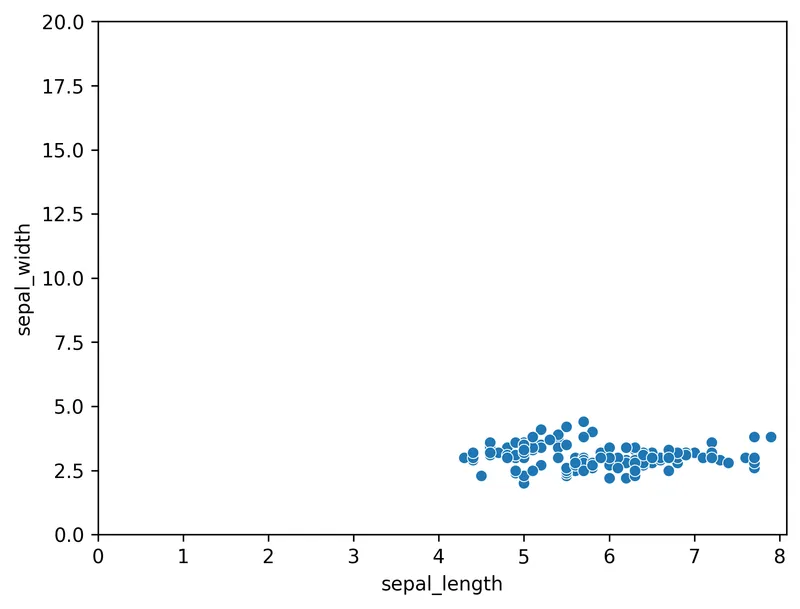
You can control the limits of X and Y axis of your plots using matplotlib function plt.xlim() and plt.ylim(). In this example, lmplot() function of seaborn is used to plot a basic scatterplot with iris dataset. There are 2 arguments in these functions;
plt.xlim(): (left, right)plt.ylim(): (buttom, top)
# library & dataset
import seaborn as sns
import matplotlib.pyplot as plt
df = sns.load_dataset('iris')

# basic scatterplot
sns.scatterplot(
   x="sepal_length",
   y="sepal_width",
   data=df
)

# control x and y limits
plt.ylim(0, 20)
plt.xlim(0, None)

plt.show()Going further
This post explains how to customize the appearance of the markers in a scatter plot with seaborn.
You might be interested in
- how to visualize linear regression
- how to create a bubble plot, a kind of scatter plot where the size of the marker is proportional to a third variable
- how to colors dots according to a variable.