📕 Add a title
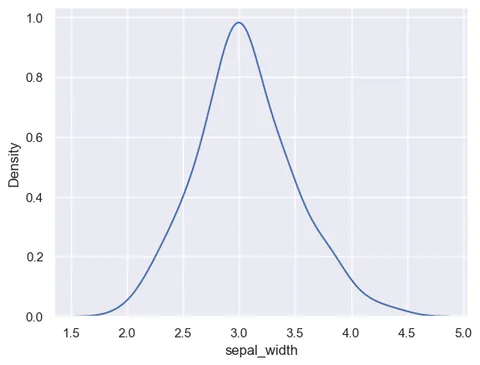
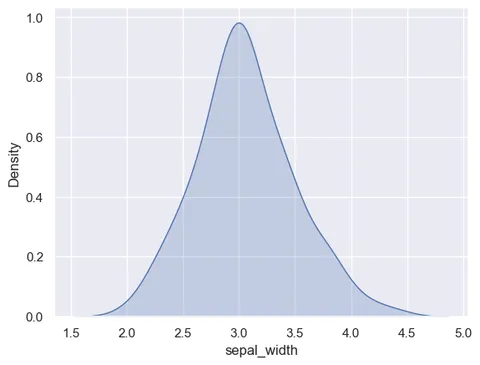
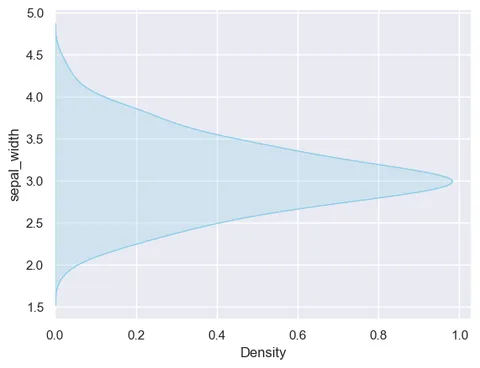
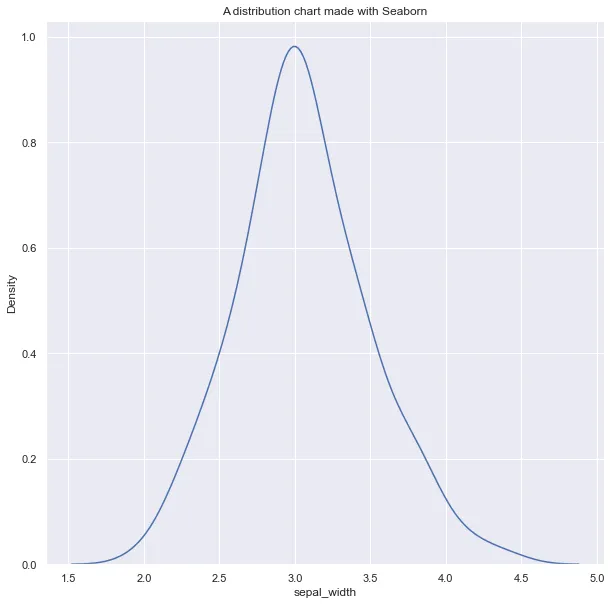
The following distribution chart is built thanks to the kdeplot() function of seaborn.
This function returns a matplotlib axes instance. Unlike pyplot itself, which has a method plt.title(), the corresponding argument for an axes is ax.set_title(). This is what you need to call to build the title:
# library & dataset
import seaborn as sns
df = sns.load_dataset('iris')

# Figure size
sns.set_theme(rc={'figure.figsize':(10,10)})

# Grey background
sns.set_theme(style="darkgrid")

# Make default density plot
ax = sns.kdeplot(df['sepal_width'])

# Add title
ax.set_title('A distribution chart made with Seaborn');🎨 Title customization
Once you've understood how to add a title to a seaborn chart, customization works the same as for matplotlib. Visit this blopost to see many customization examples 🎉.